State Street Corporation
State Street × Growth
Partnering with State Street, we built a visualization depicting the scale, growth, and complexity of 200 years of finance. We combed through a database of 40,000 financial indicators and built prototypes to dig into selected data. Of the many possible stories to tell, we focused on four facets of growth: data, connectivity, complexity, and scope.
Capabilities
- Data analysis and storyfinding
- Desktop/installation application
- Front-end and back-end implementation
- Design of installation, visual interface, and data-driven interaction
Challenges
- Build an installation showing
the growth of the financial sector
from different angles. - With access to massive
amounts of global financial data,
what can we create for an event
on the future of technology
and finance?
Achievements
- Installation built in 4 weeks
- In 1 week, sifted stories
from 40,000 spreadsheets - Set up installation in person
- Reshaped and rewritten for
the web in less than 4 weeks
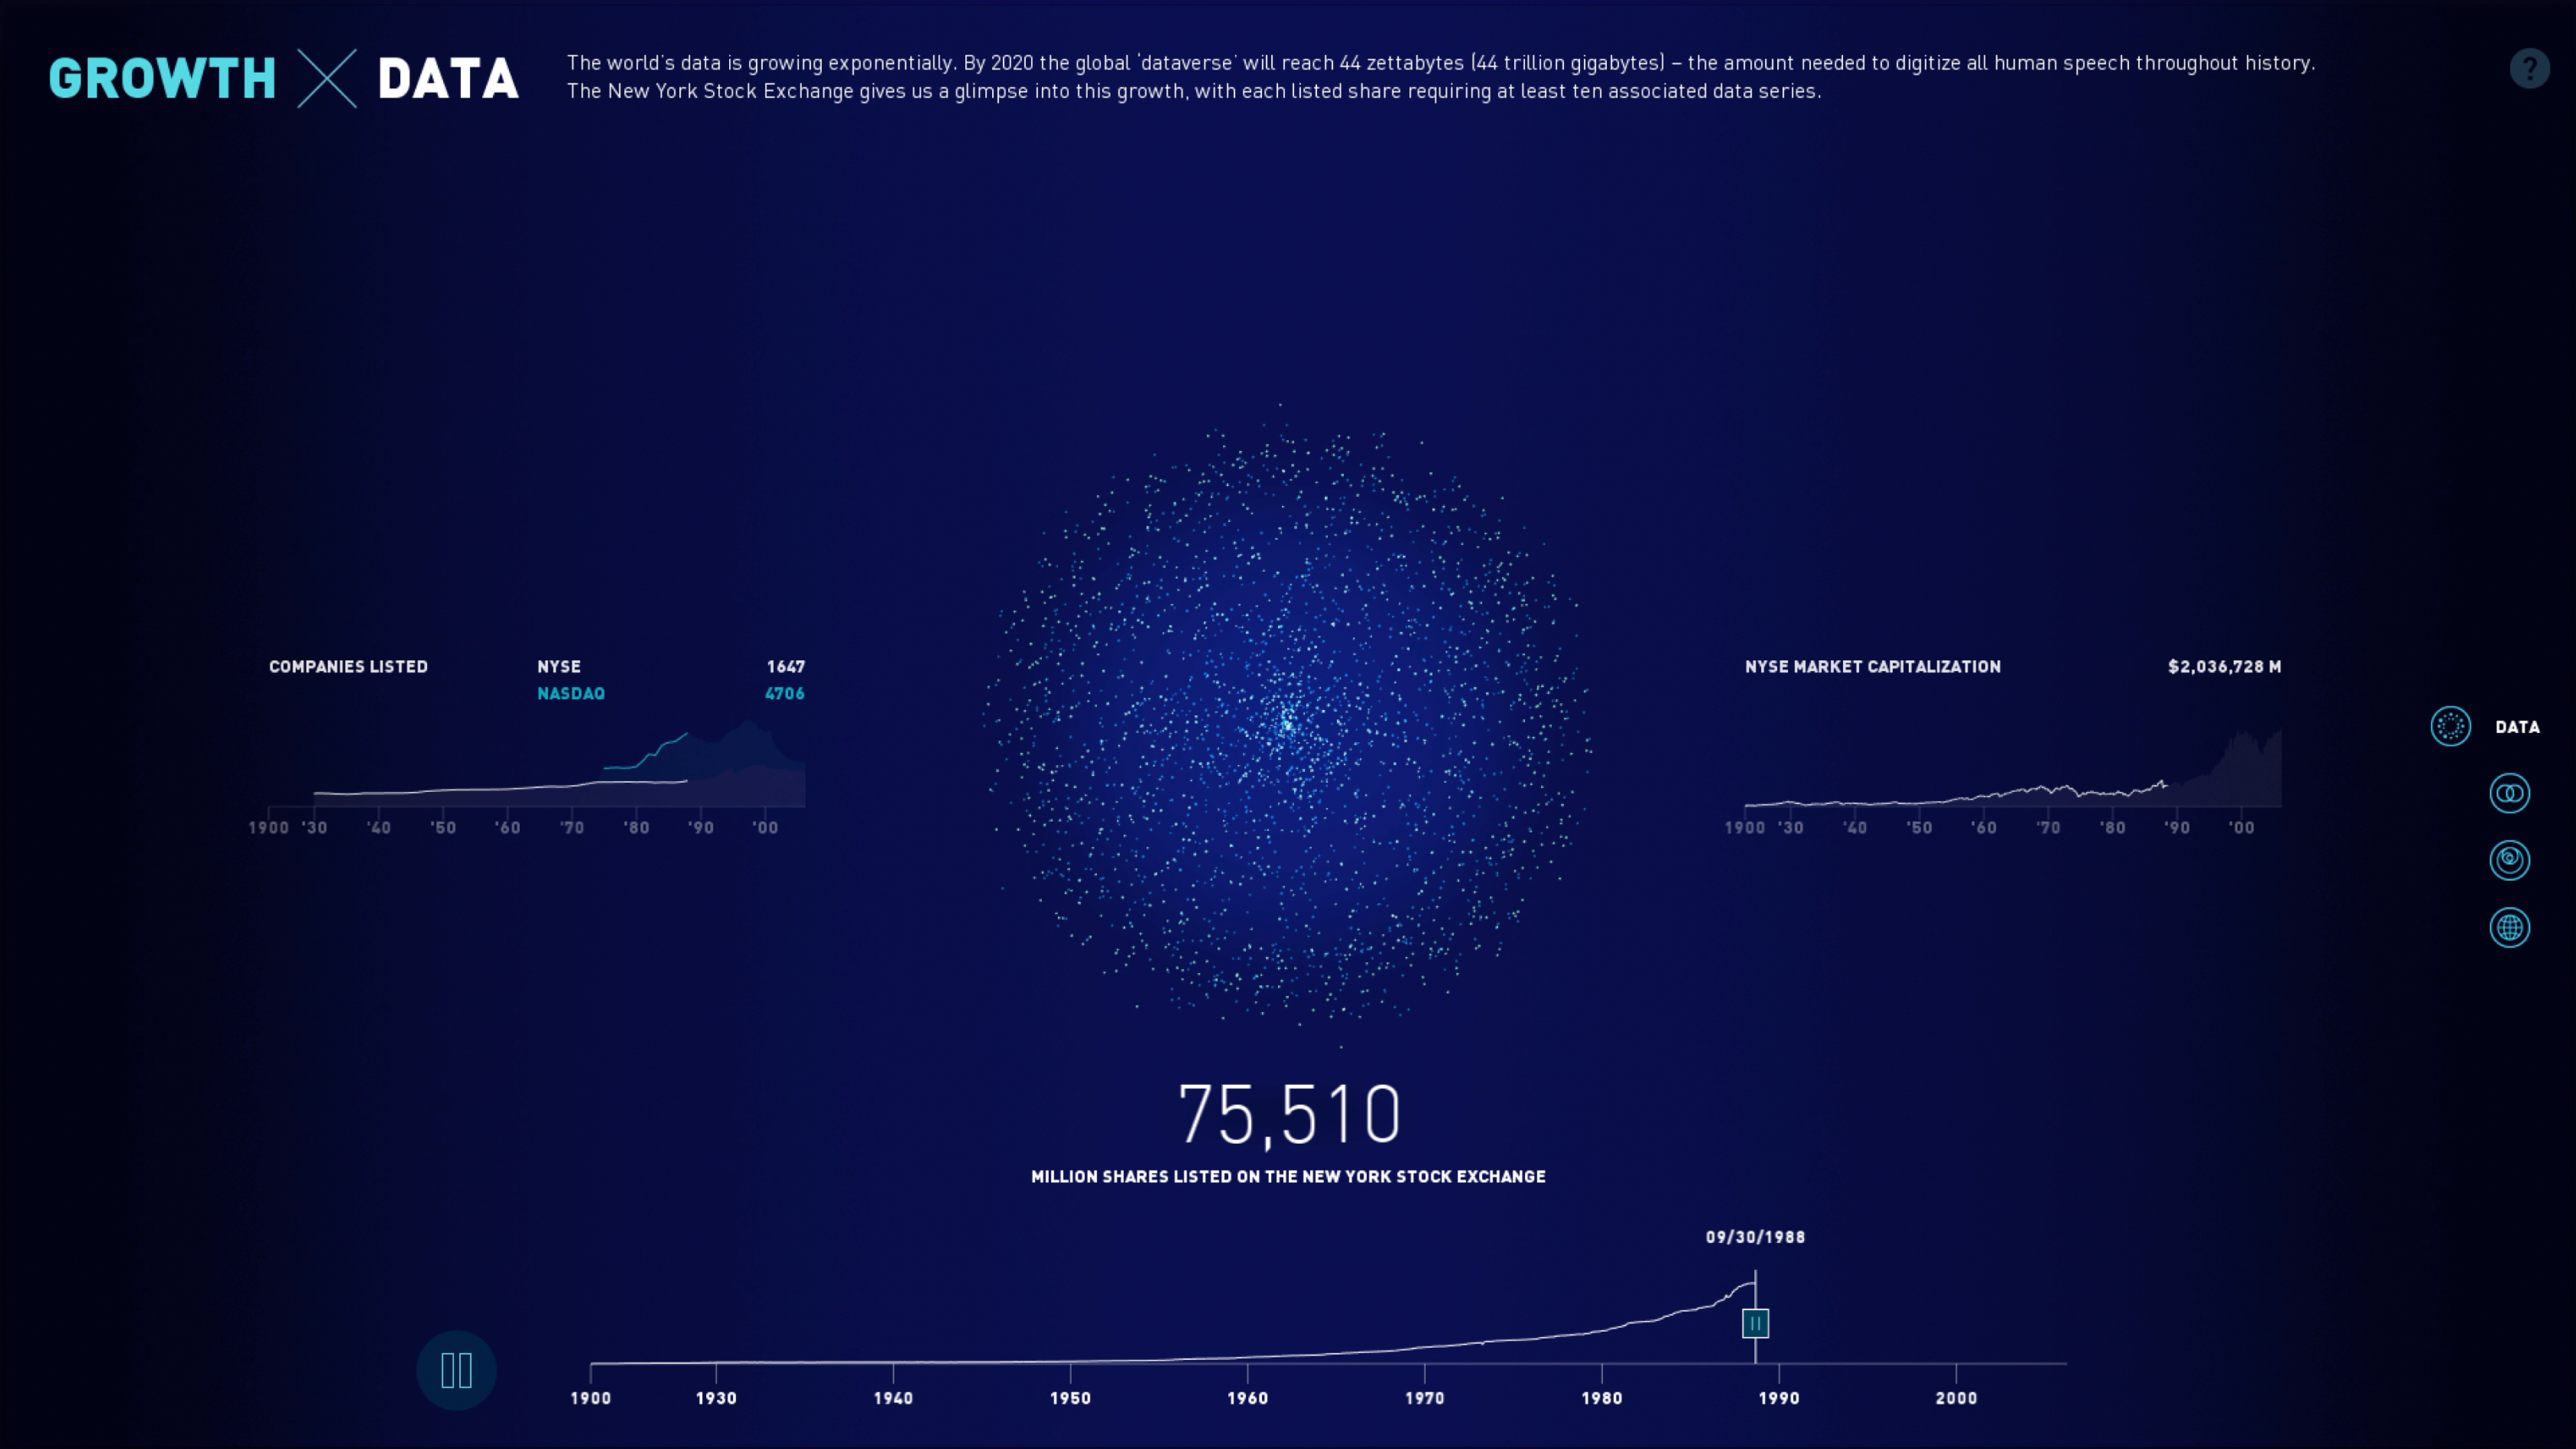
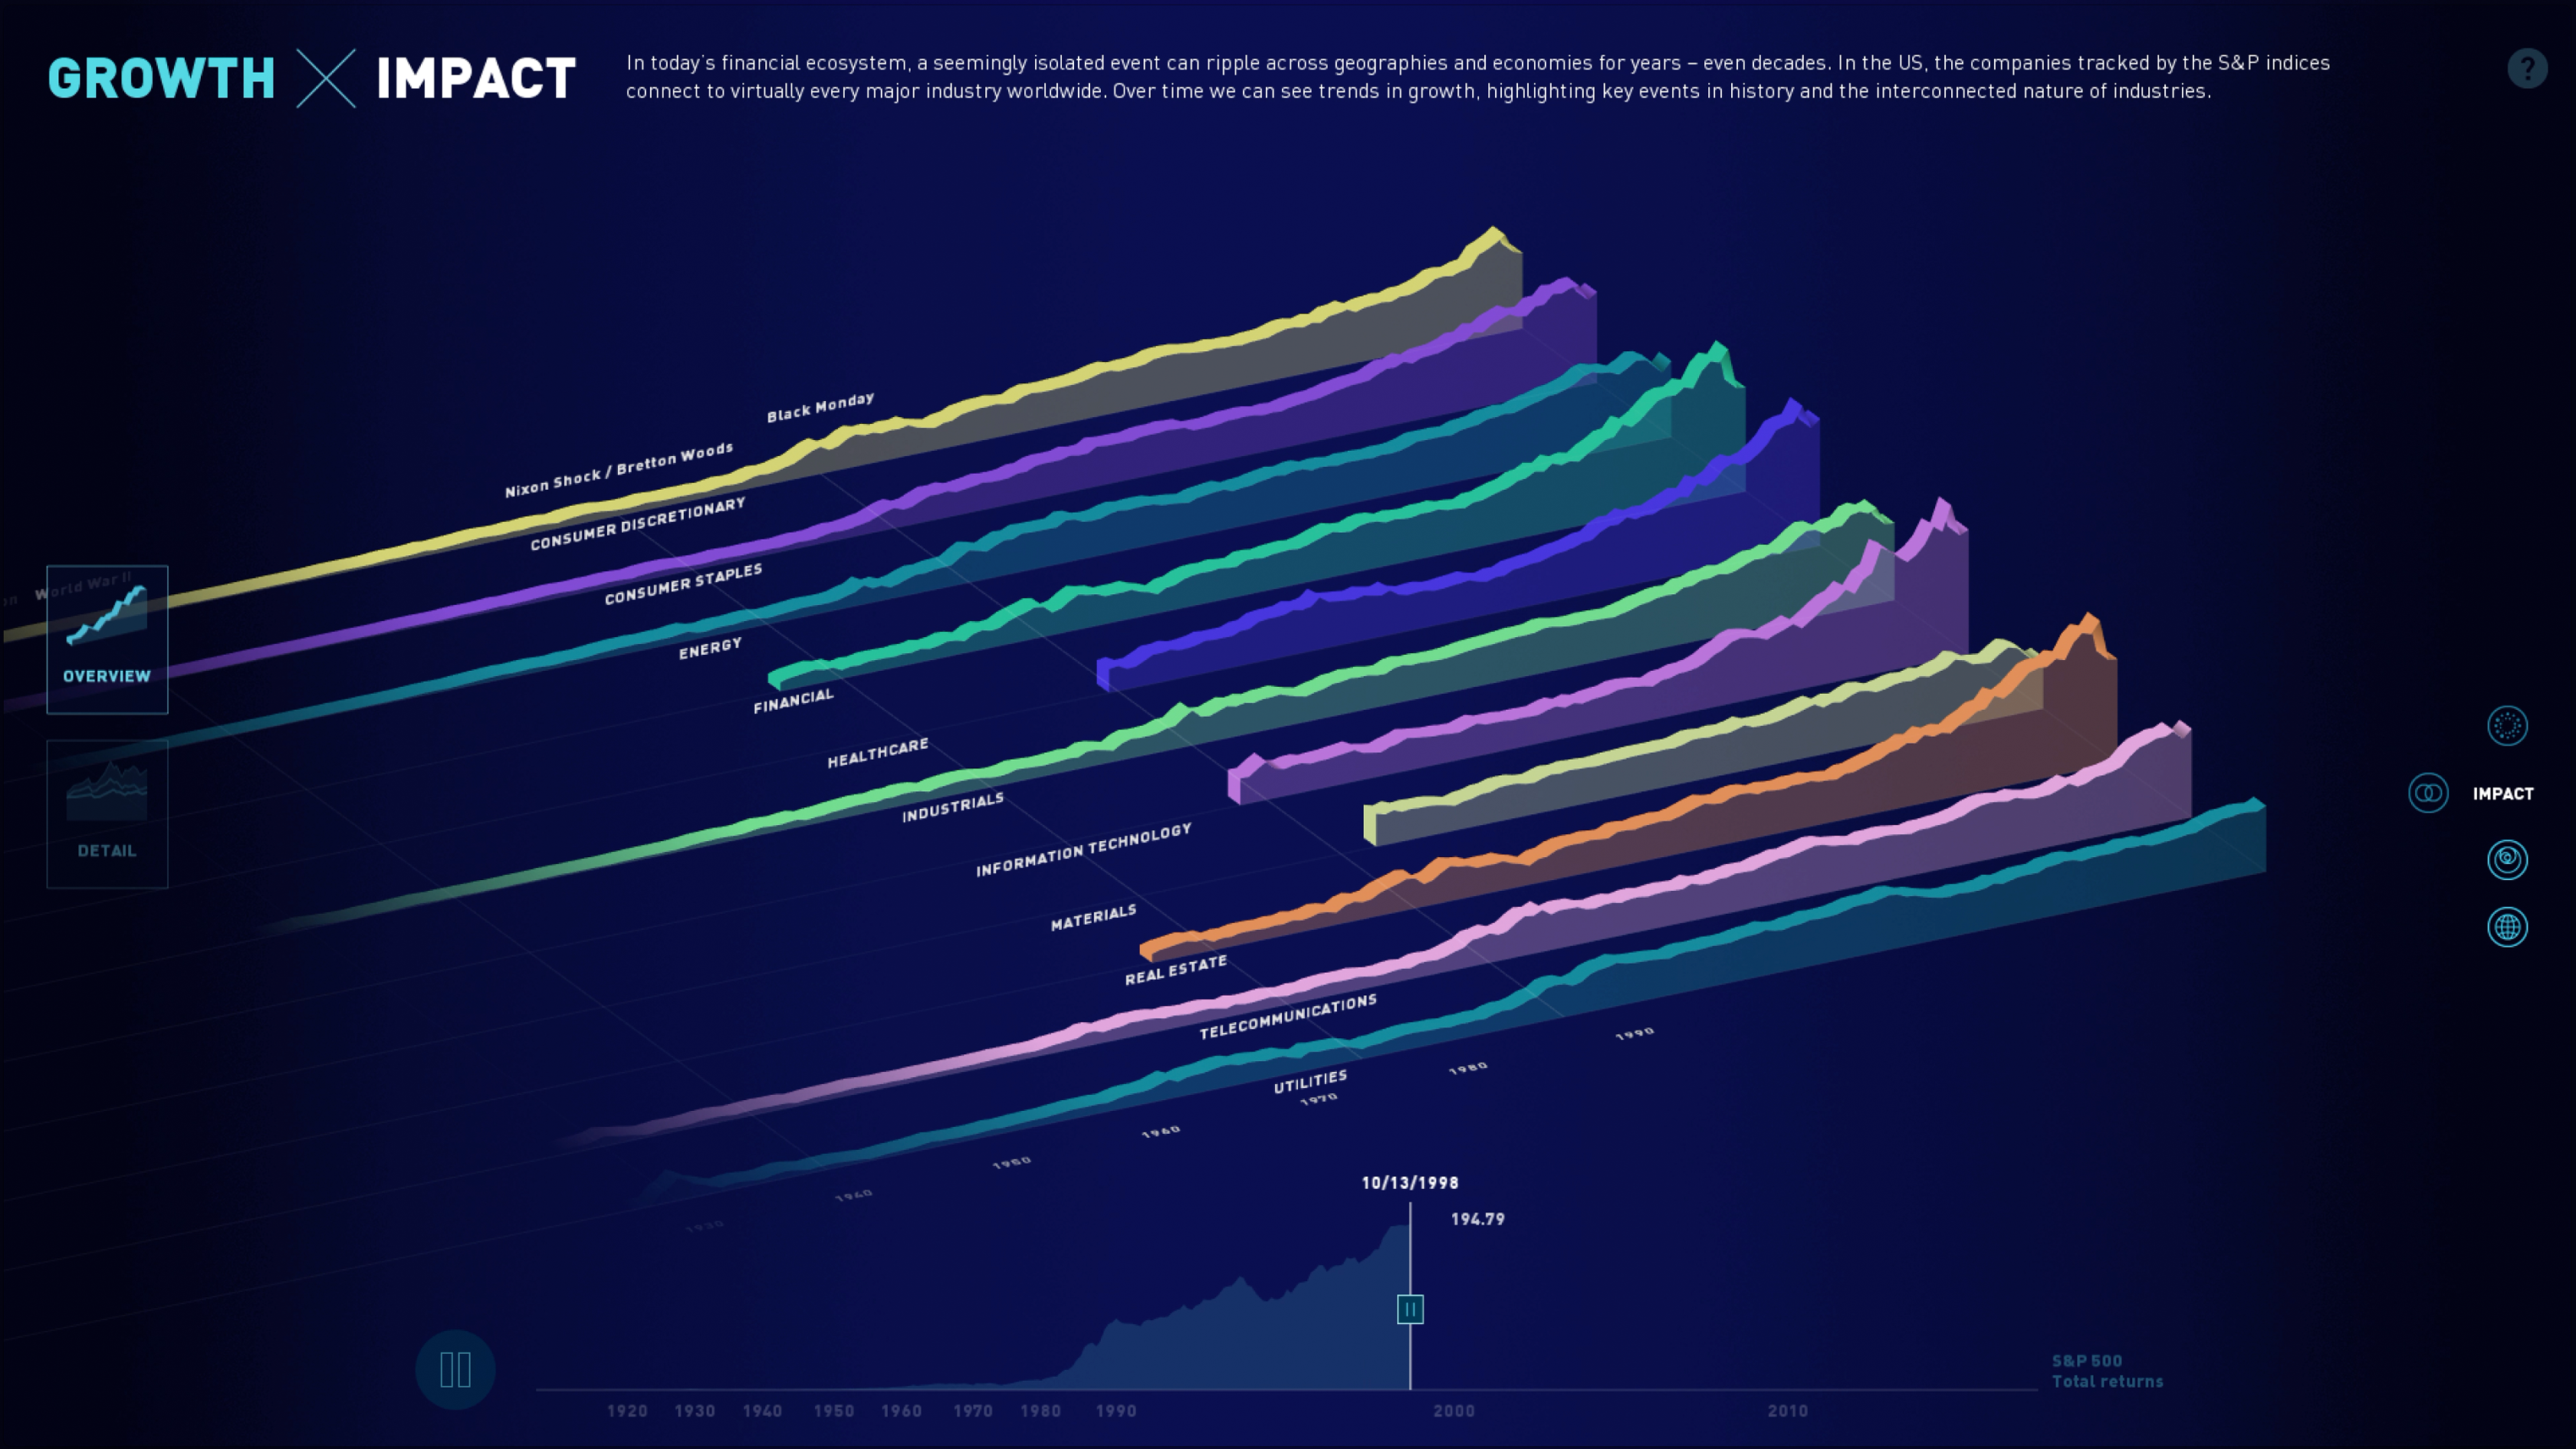
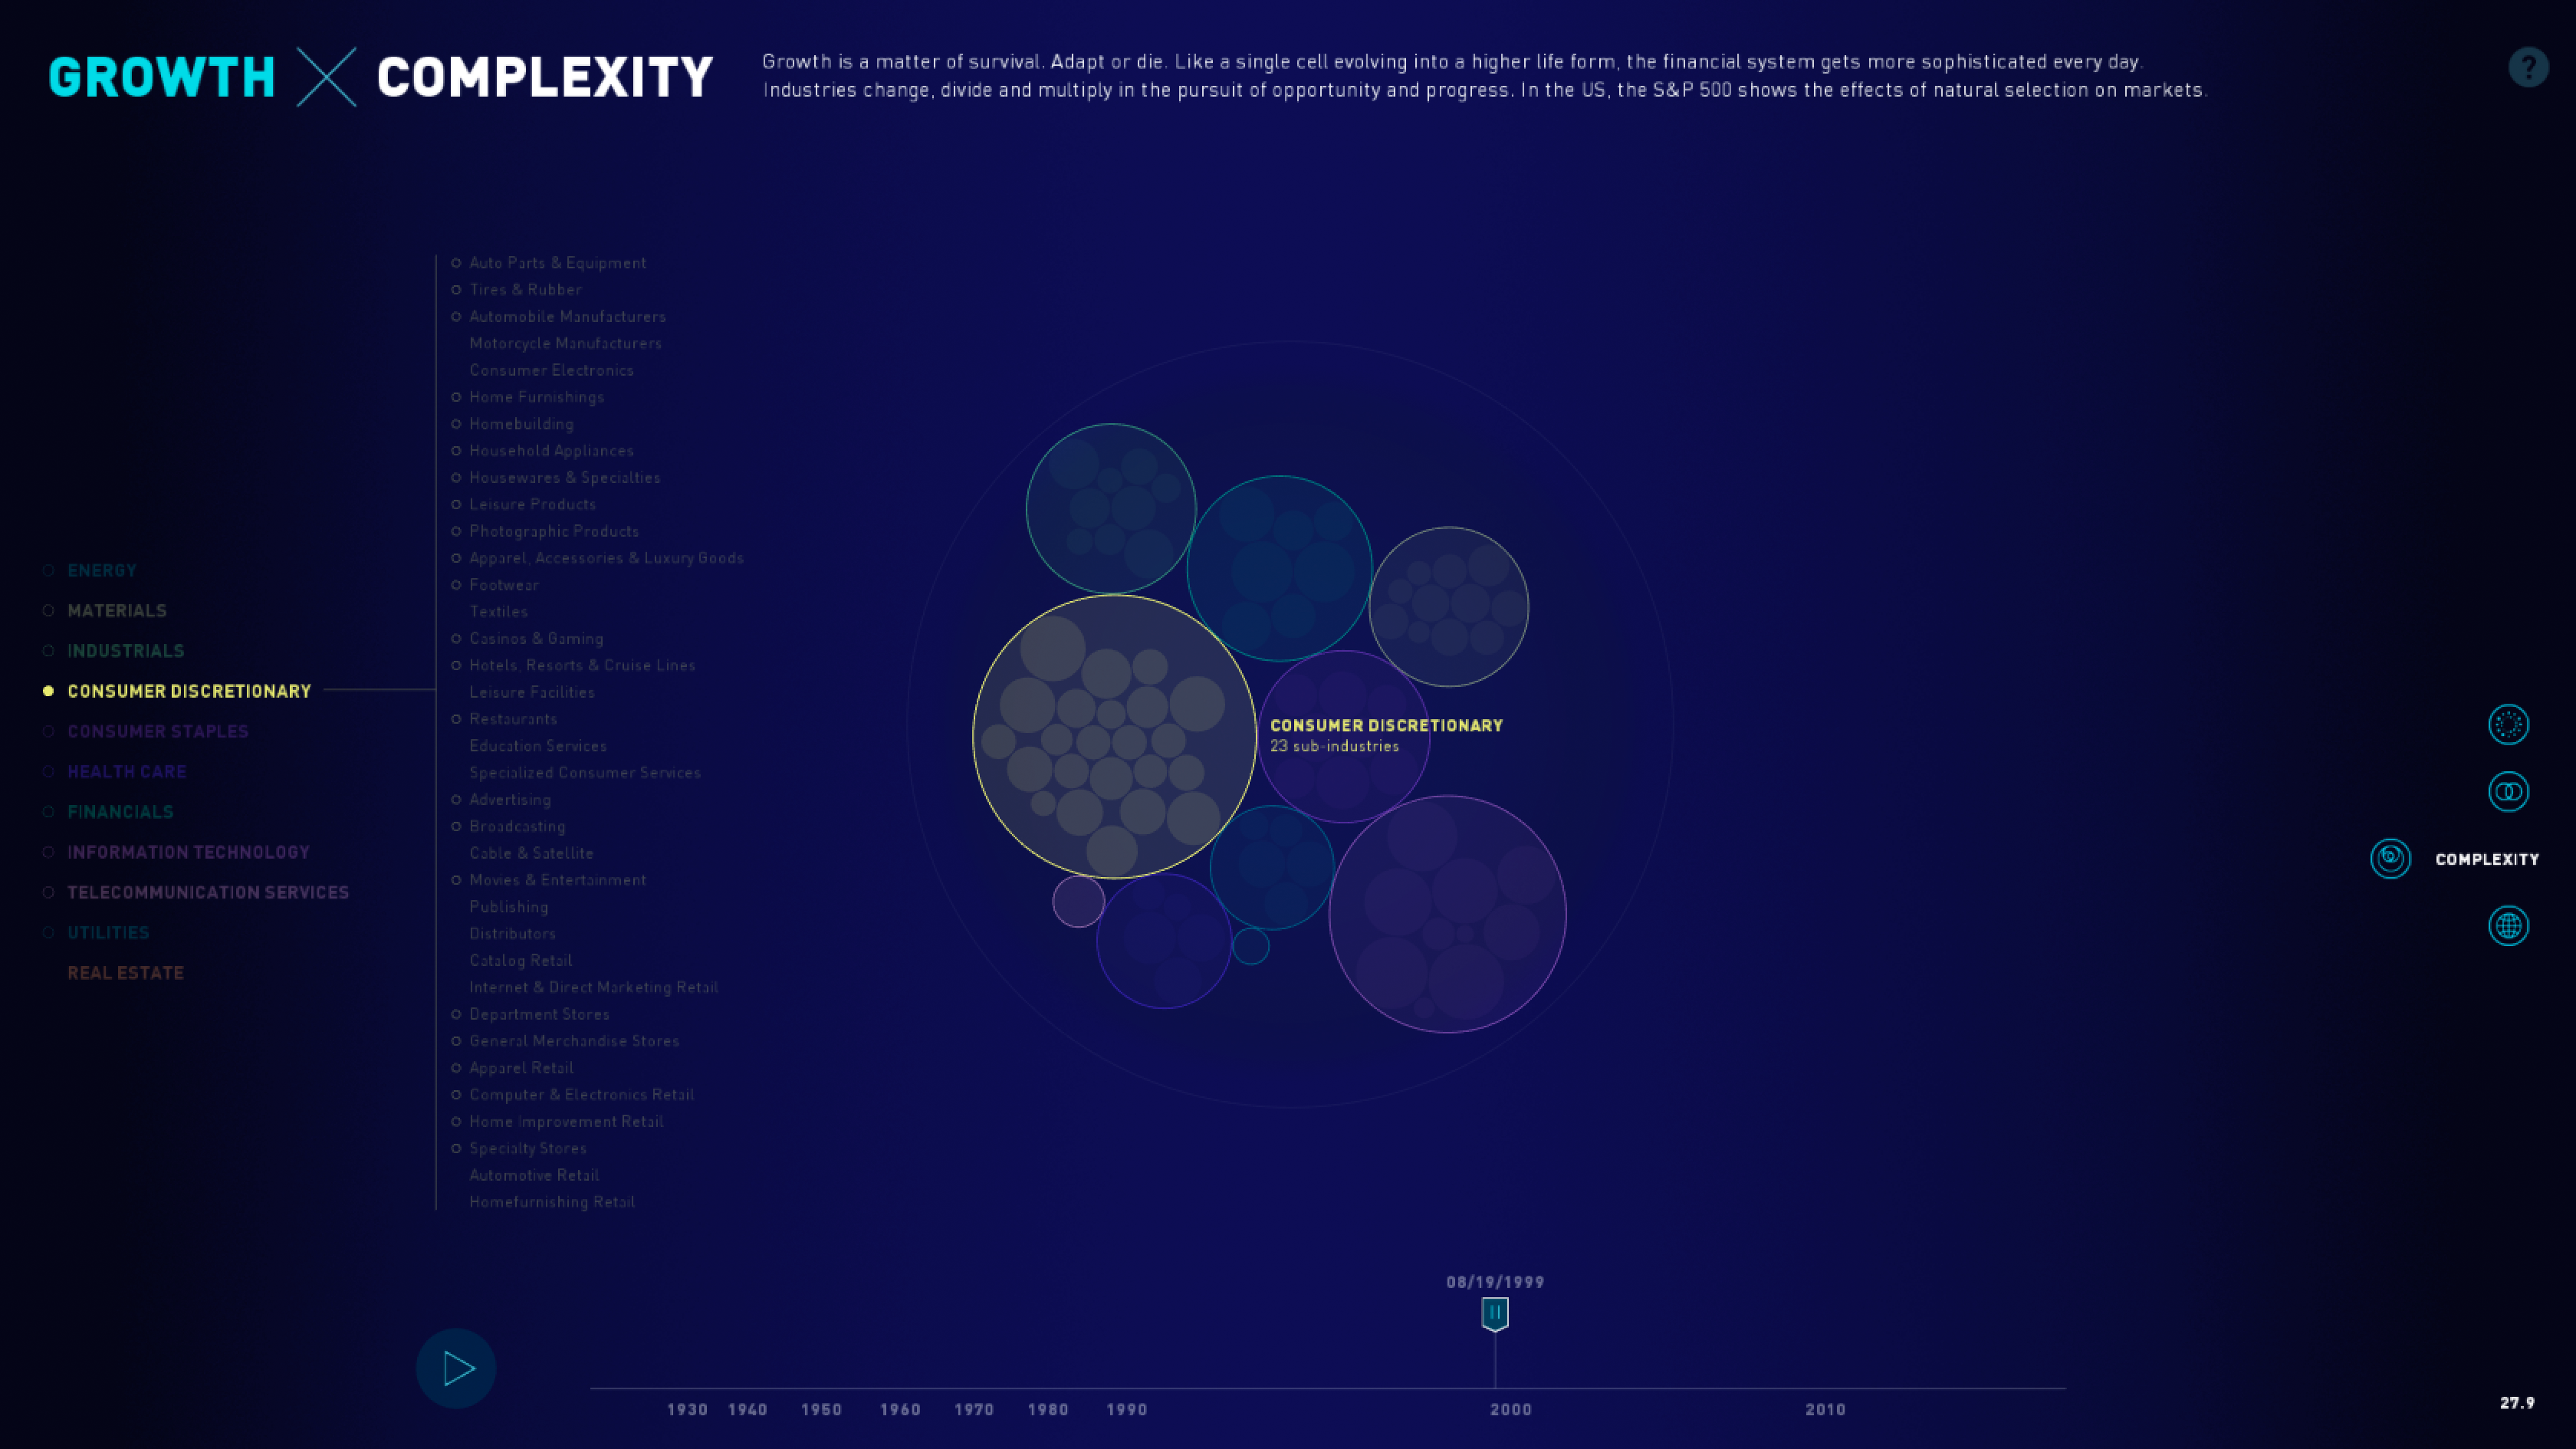
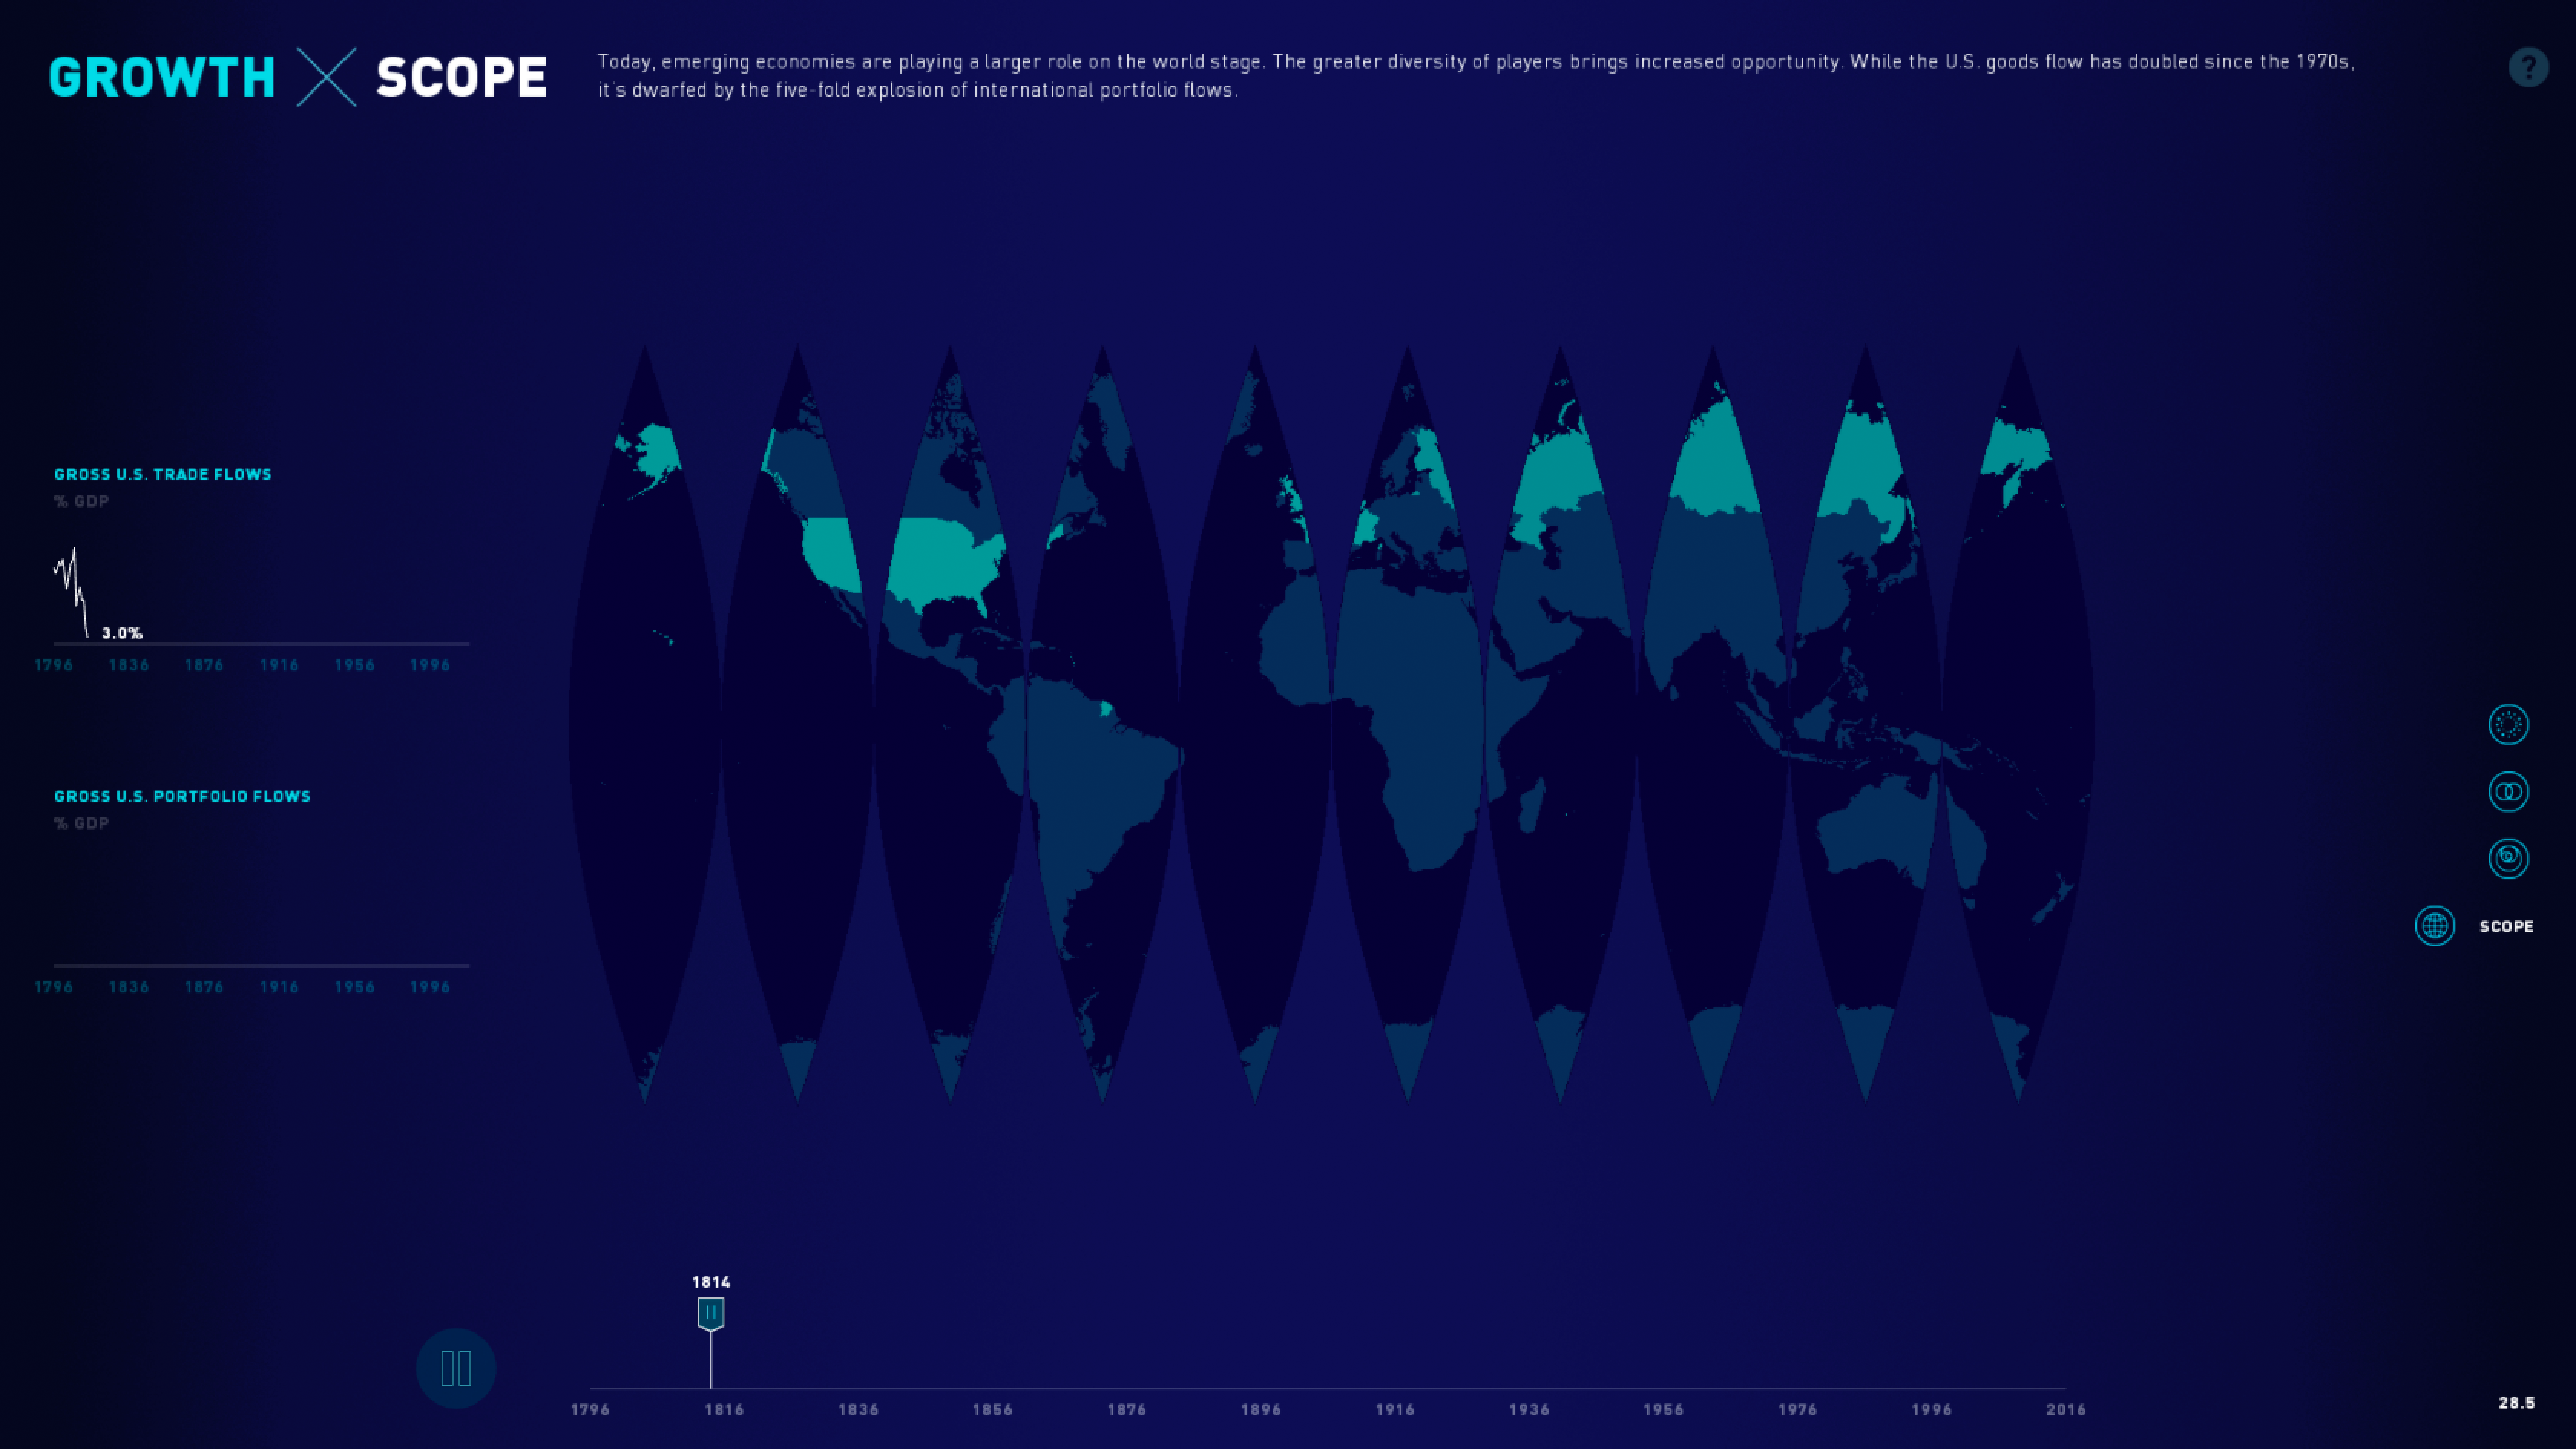
The visualization reveals the exponential growth of shares listed in the stock market since the 1980s. A second panel uses S&P closing prices to depict the connected nature of industries in relation to wars and recessions. In a third view, we see how the growing complexity of industries reflects societal changes, such as the decrease of steel and rise of biotechnology in the U.S. Finally, users can explore a map of global trade and see the increasing prominence of emerging markets.
The result is an installation created in just four weeks that allows users to immerse themselves in the intricacies of global finance.