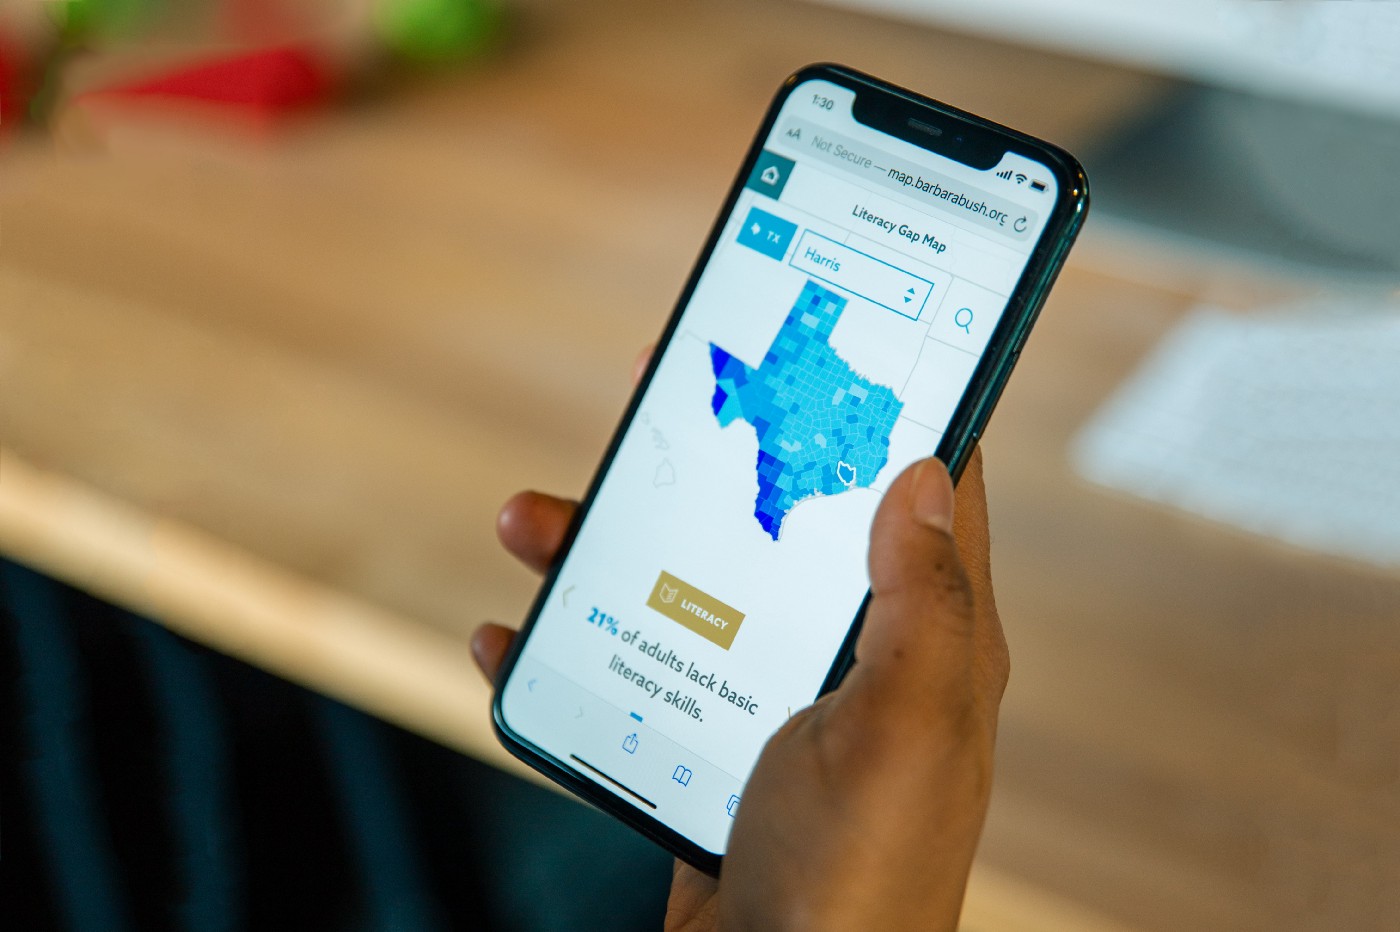
It’s been well established that the U.S. is in the midst of a literacy crisis. One in five U.S. adults struggle to read basic sentences, fill out a form, or understand basic vocabulary, and limitations like these prevent people from navigating the world with dignity.
Naturally, one of the first steps towards helping people with unmet literacy needs is developing an understanding of who and where these people are. But there’s a problem. The United States hasn’t conducted a comprehensive study on adult literacy since 2003, and before that they hadn’t conducted a study since 1992. While other more recent studies, such as the Program for the International Assessment of Adult Competencies (PIAAC), have explored adult education and skills more generally, no one seems to be keeping track of literacy skills specifically.
This is where the Barbara Bush Foundation asked us to help. They wanted us to conduct a thorough data review that definitively outlines what is and isn’t available. Our primary resource was the first study conducted in 2003 — the National Assessment of Adult Literacy, or NAAL. Even though the study is more than 15 years out of date, stark regional disparities hint at the larger socioeconomic trends and factors that go hand in hand with literacy and education. NAAL produced a set of county-level literacy scores, identifying the percent of residents from each county who lack basic prose literacy skills. To be deemed capable of basic prose literacy, individuals must be able to perform the skills listed above — reading basic sentences, filling out forms, understanding basic vocabulary, as well as other similar tasks. We then sought out demographic and socioeconomic data to help contextualize the NAAL literacy score.
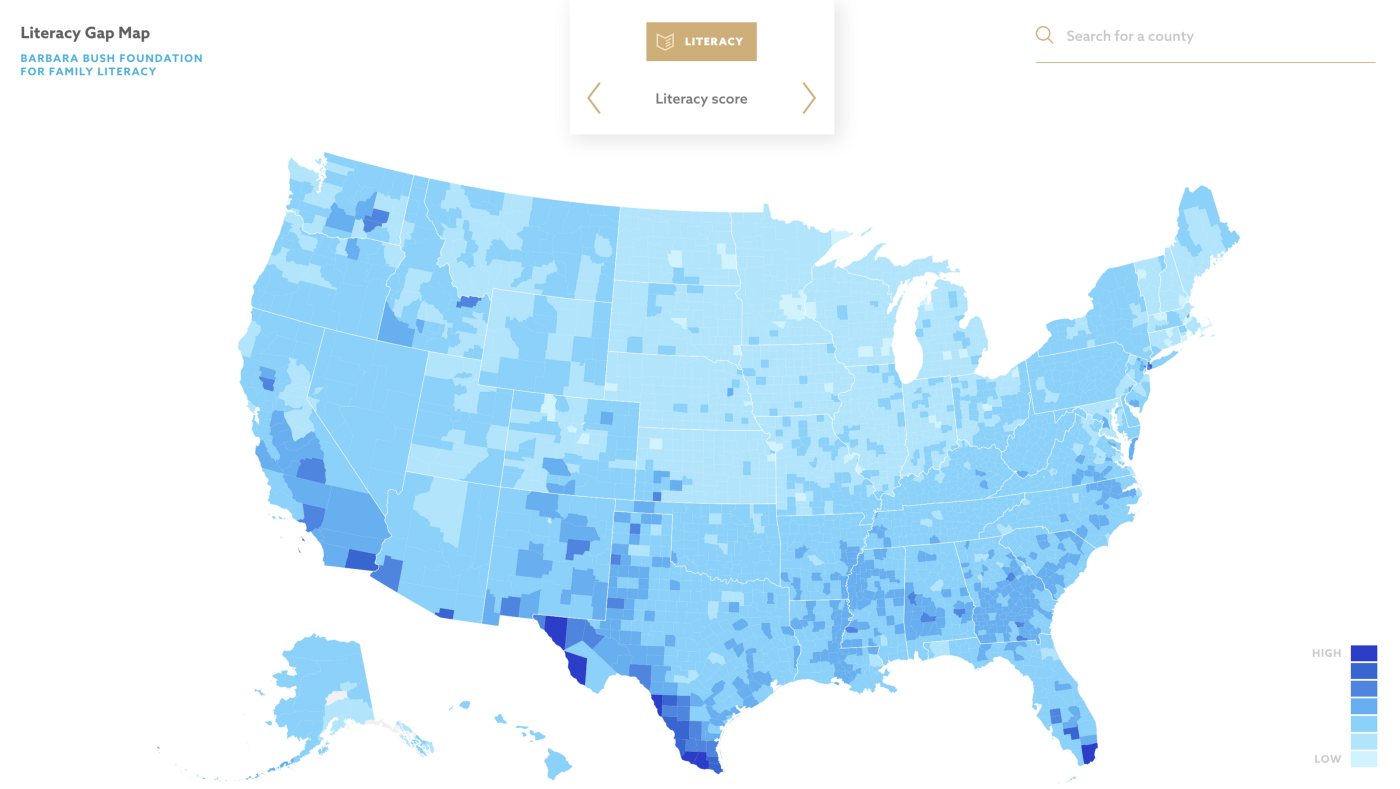
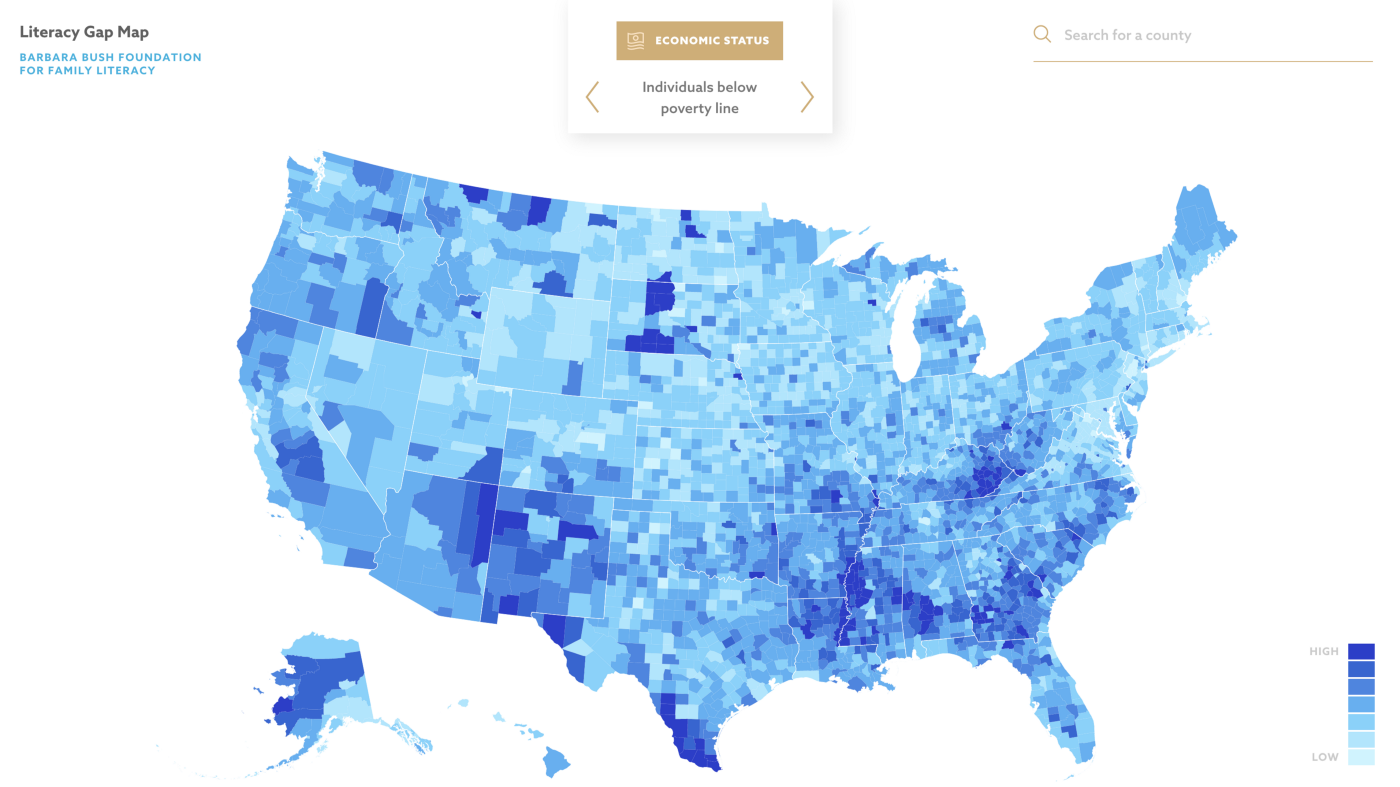
The Foundation asked us to build a map-based tool to geographically present the data that we collected. The results are striking. Note the divide in prose literacy skills running along the Mason Dixon line in the map above — counties in the Upper Midwest and Northeast consistently report lower rates of unmet literacy needs, and areas of lowest literacy are clustered in the Deep South and along the Southern border. This map, combined with the maps of the many demographic and socioeconomic indicators we collected, paints a sad picture. Clicking through the carousel of indicators in the live tool, it’s clear that low literacy often concentrates in areas that have limited access to health care, more residents living below the poverty line, and higher populations of Hispanic/Latinx and Black/African American residents.
Every community faces a unique set of obstacles or circumstances, calling for specific remedies and approaches for educating adults and ending cycles of illiteracy.
Our map tool can help educators and non-profits narrow in on areas that need the most assistance, and identify factors that compound, correlate with, and contribute to the community’s lack of literacy. The Barbara Bush Foundation will be able to use these factors to help inform literacy campaigns in communities across the United States.
Since the literacy data comes from a different source than the demographic data, we aren’t able to identify the percentage of people who are both struggling with poverty or education and have low literacy. At the county level, we only have the ability to draw connections between aggregated literacy data and aggregated demographic data within a community. That is, we don’t have the data to cross cut literacy with other indicators to determine, for example, the percent of people in a single county with below basic literacy who also are living below the poverty line.
We do, however, have some of this data aggregated at the country level. As we have seen in the maps above, geography has a huge influence on literacy, even within states, so there’s only so much we can conclude from country-level data. The statistics, though, are still incredibly striking.
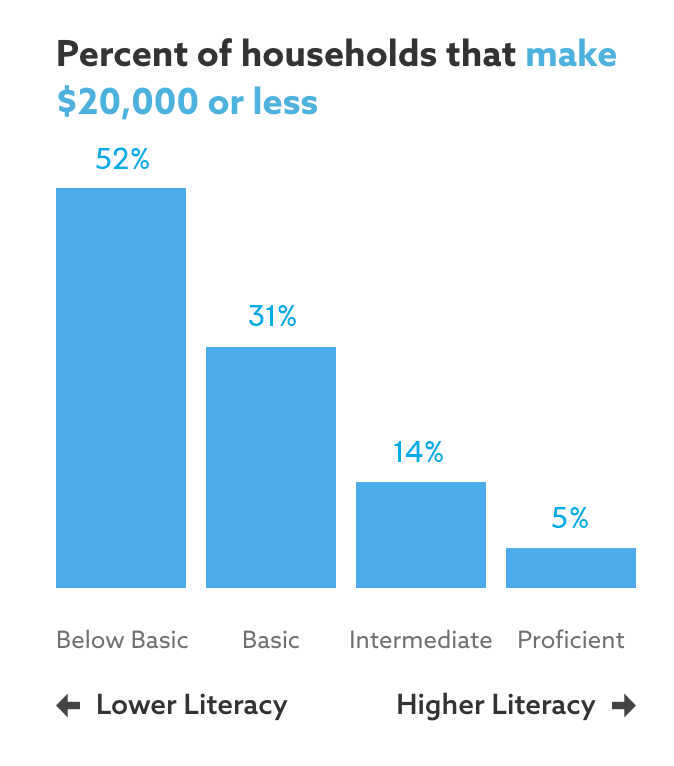
In 2003, individuals with below basic literacy were considerably more likely to experience poor health and to live in households making less than $20,000. Conversely, individuals with a proficient level of literacy are all but guaranteed to be in at least moderate health and to be living in households above the poverty line.
The Barbara Bush Foundation released our tool publicly this November at their annual summit in Washington, D.C. We’re excited to see how they leverage the data and our tool to help promote action and target communities that will benefit from literacy intervention.
We’d love to hear what you’re working on, what you’re curious about, and what messy data problems we can help you solve. Drop us a line at hello@fathom.info, or you can subscribe to our newsletter for updates.