The Sabeti Lab
Operation Outbreak
Capabilities
- Rapid prototyping and application architecture
- Front-end and back-end implementation
- Design of user experience, visual interface, and data-driven interaction
Challenges
- Rebuild the backend application from the ground up to support larger and more frequent simulations
- Coordinate between multiple different teams, stakeholders, and visions for the project to create something that supports the collected vision of all members
Achievements
- Built unique, fully functional infectious disease tracking software for students
- Streamlined the input required from teachers and facilitators, so they no longer need expert knowledge to set up a simulation
- Laid a solid foundation for further development into the future
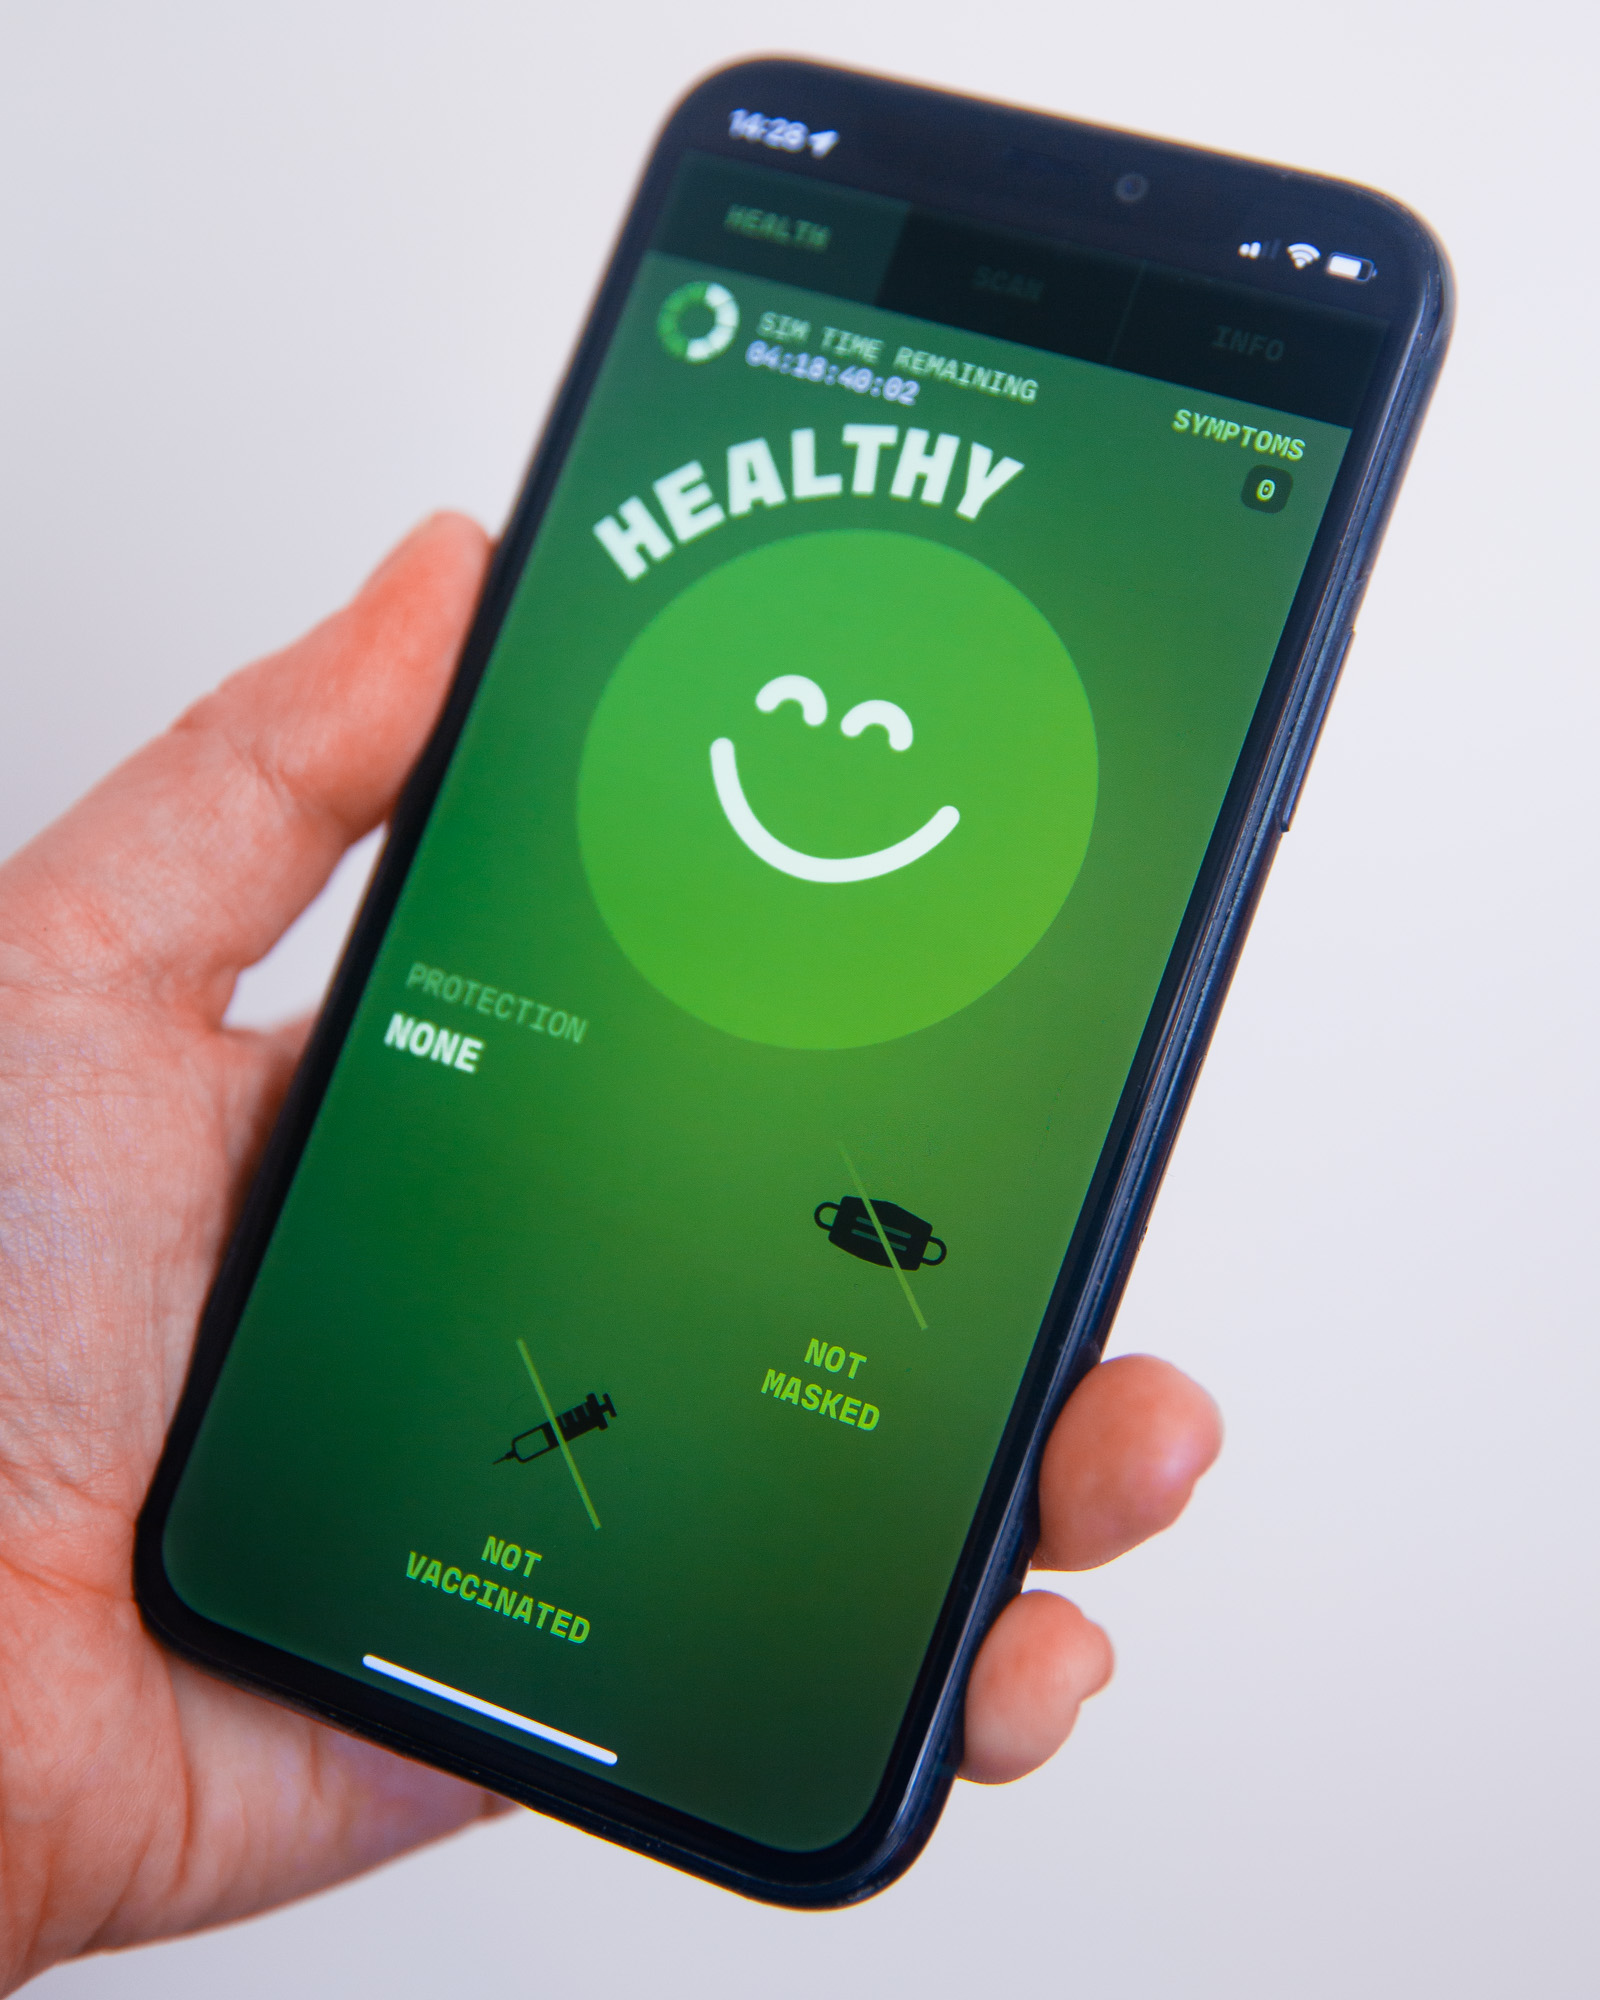
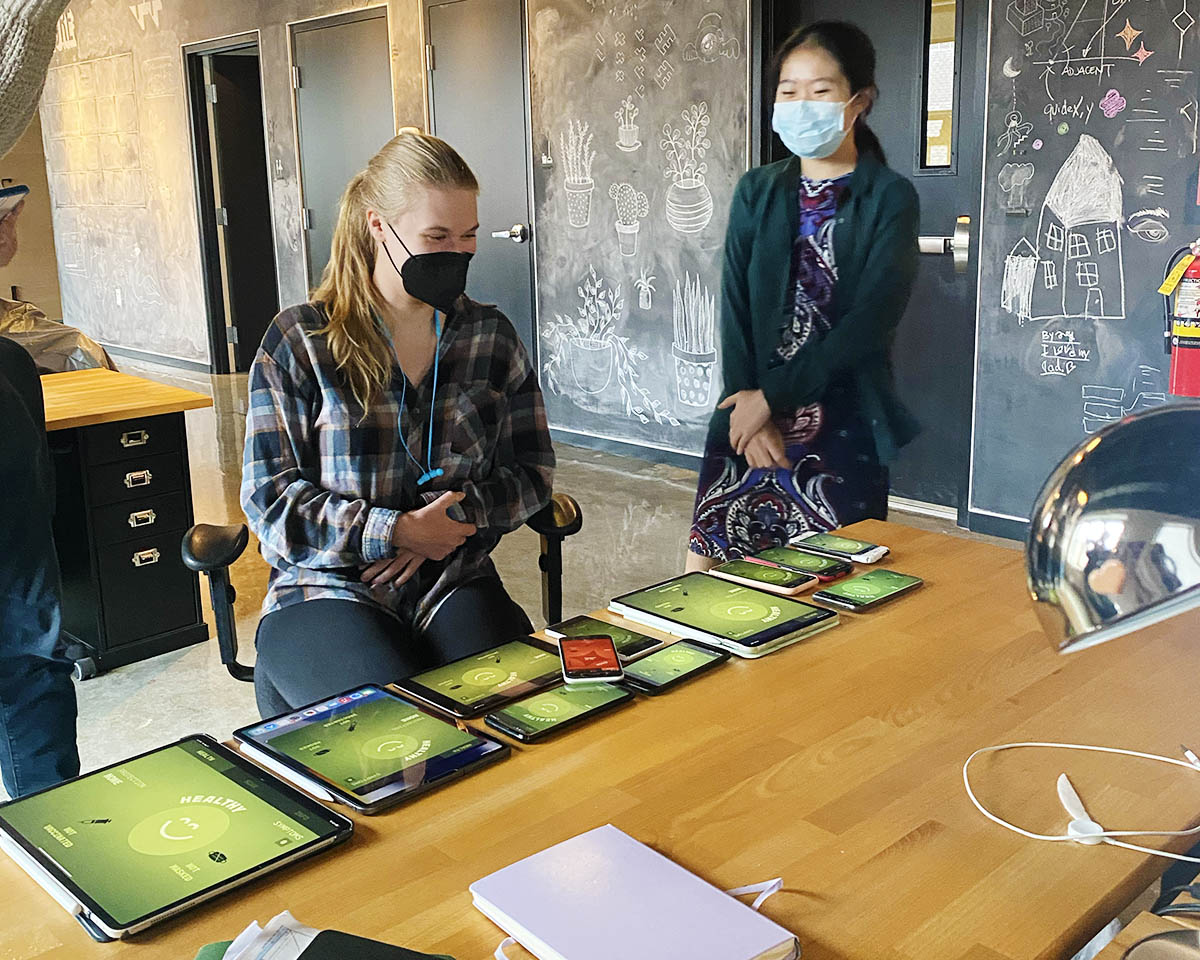
Operation Outbreak is an infectious disease simulation activity that centers around spreading a virtual pathogen via phones to teach students about outbreak response. We built three applications – OO Creator for setting up a simulation; OO Lookout to enable data collection during the simulation; and OO Visualizer to visualize the post-simulation data. We also redesigned the mobile app, and rebuilt the backend application to better support larger and more frequent simulations in the future. We worked closely with all stakeholders and made sure their goals were reflected in the final applications, consulting their collective expertise in middle school education, infectious disease research and response, and statistical modeling.
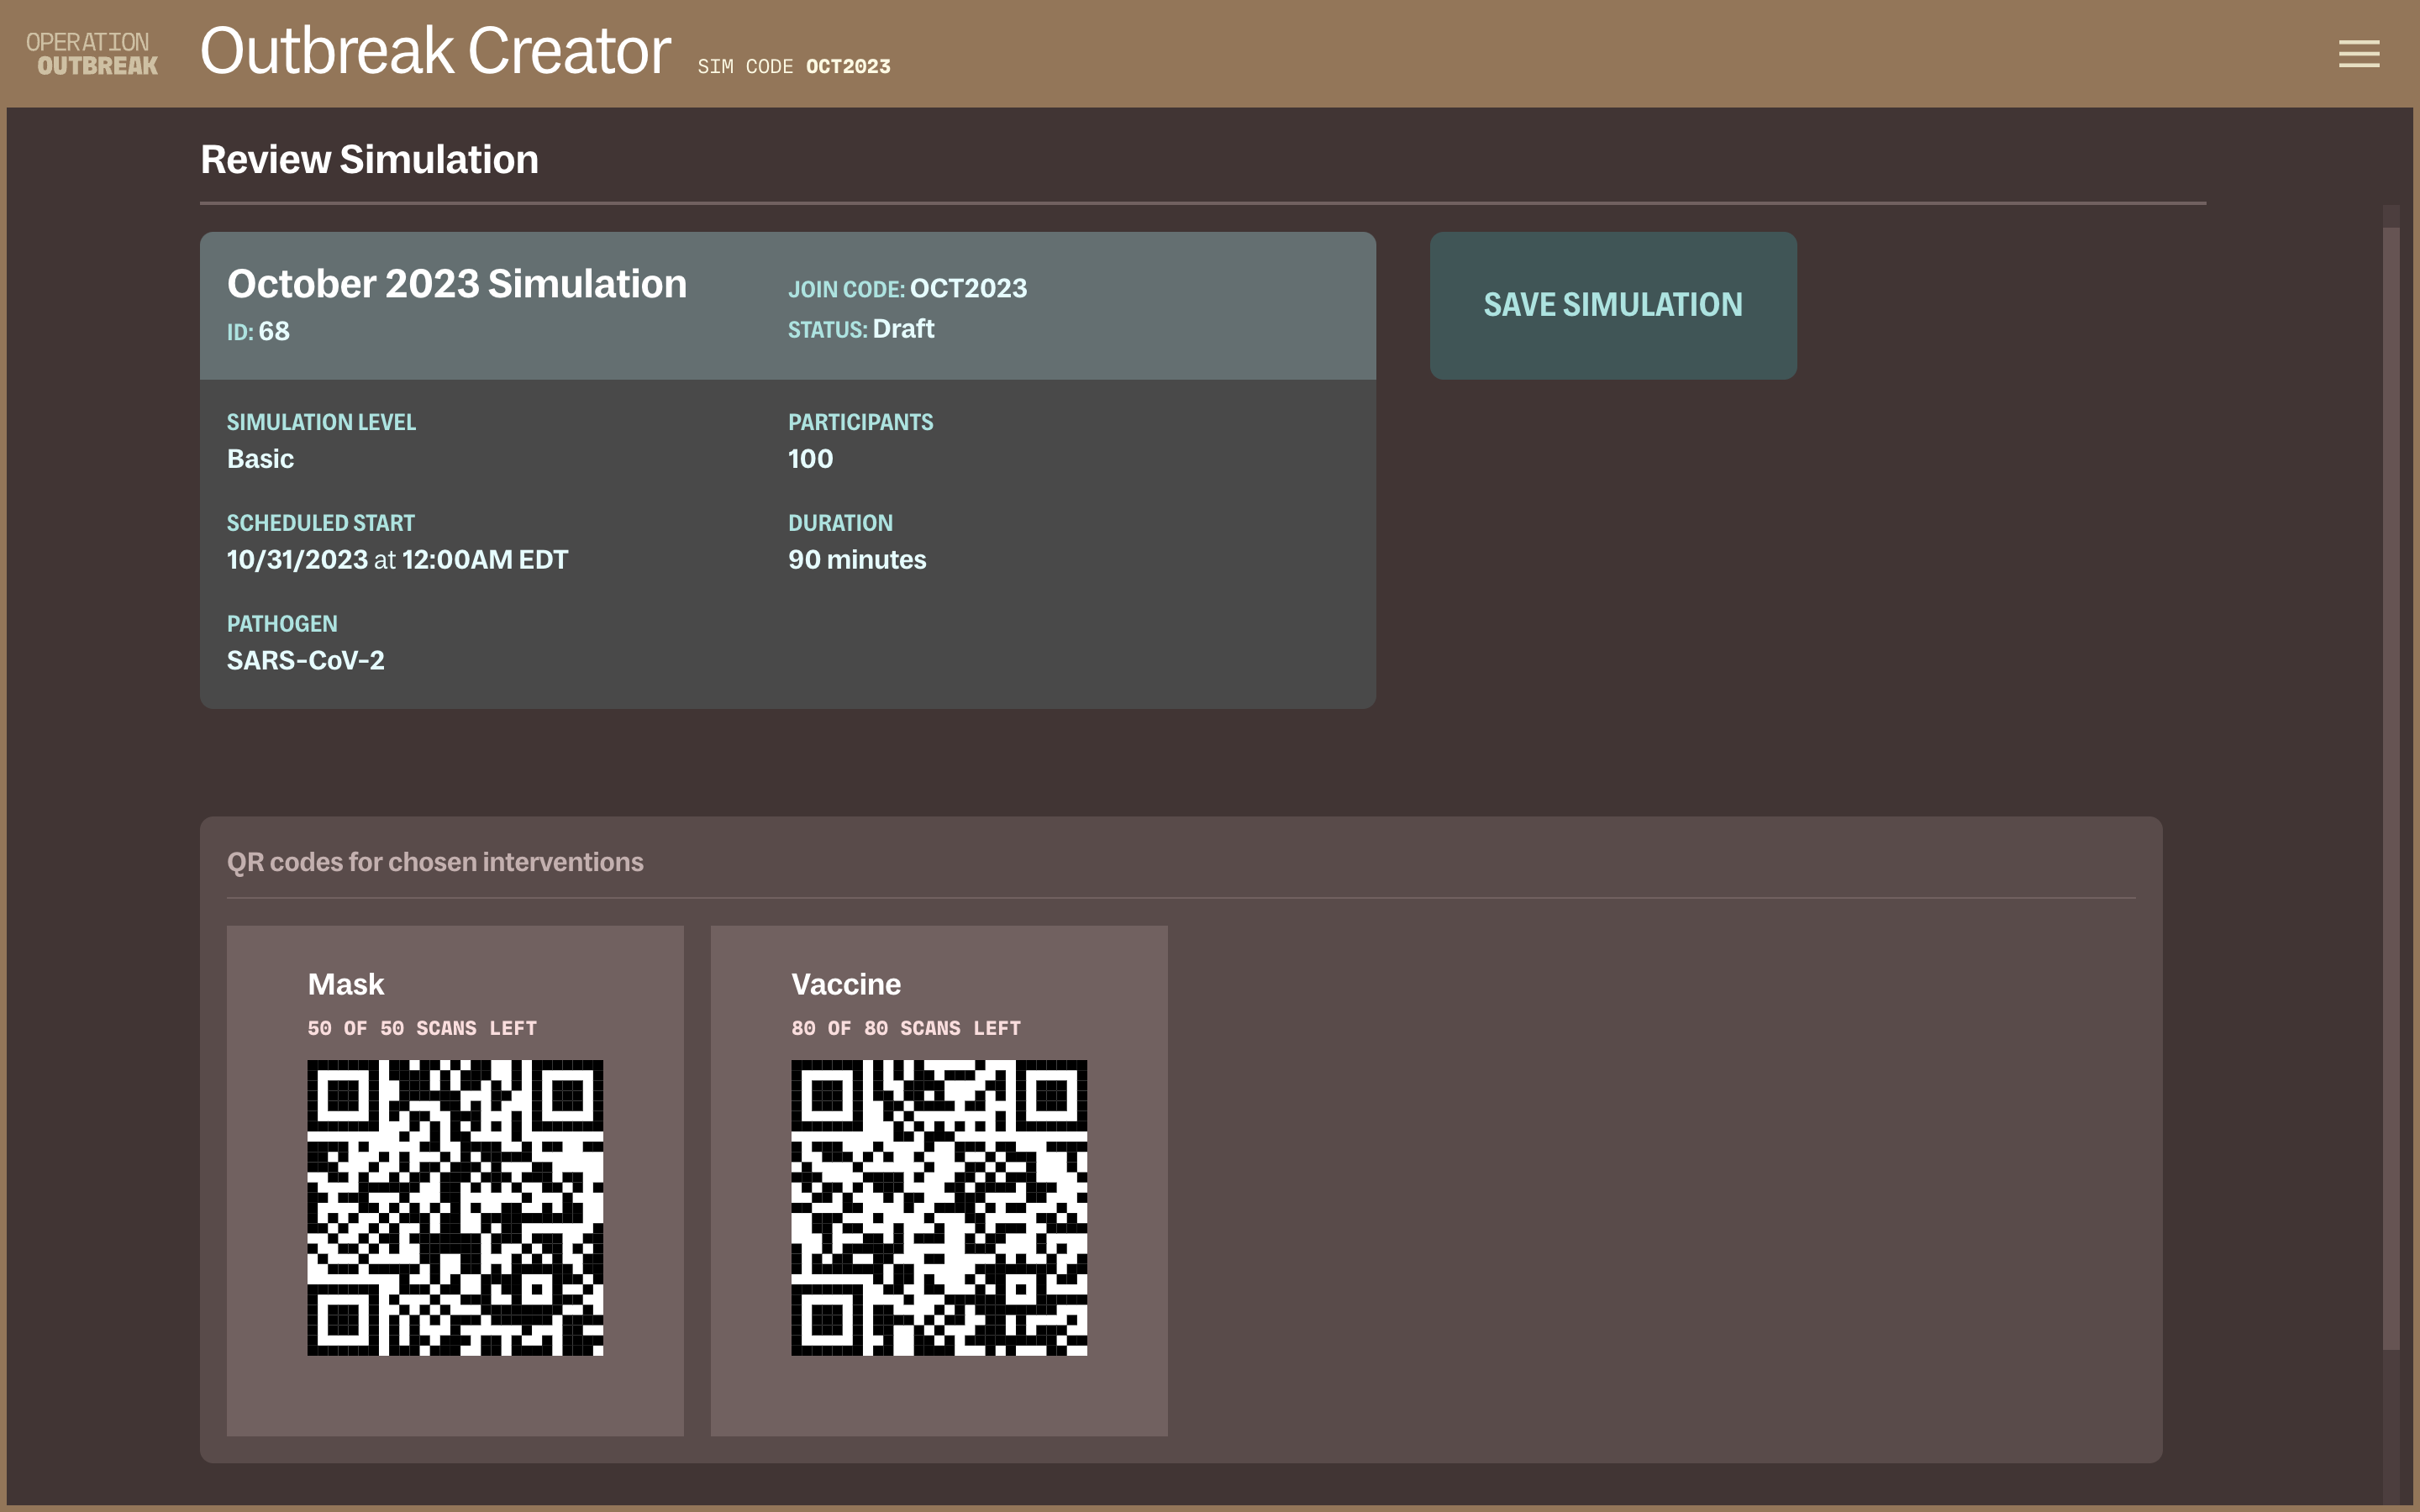
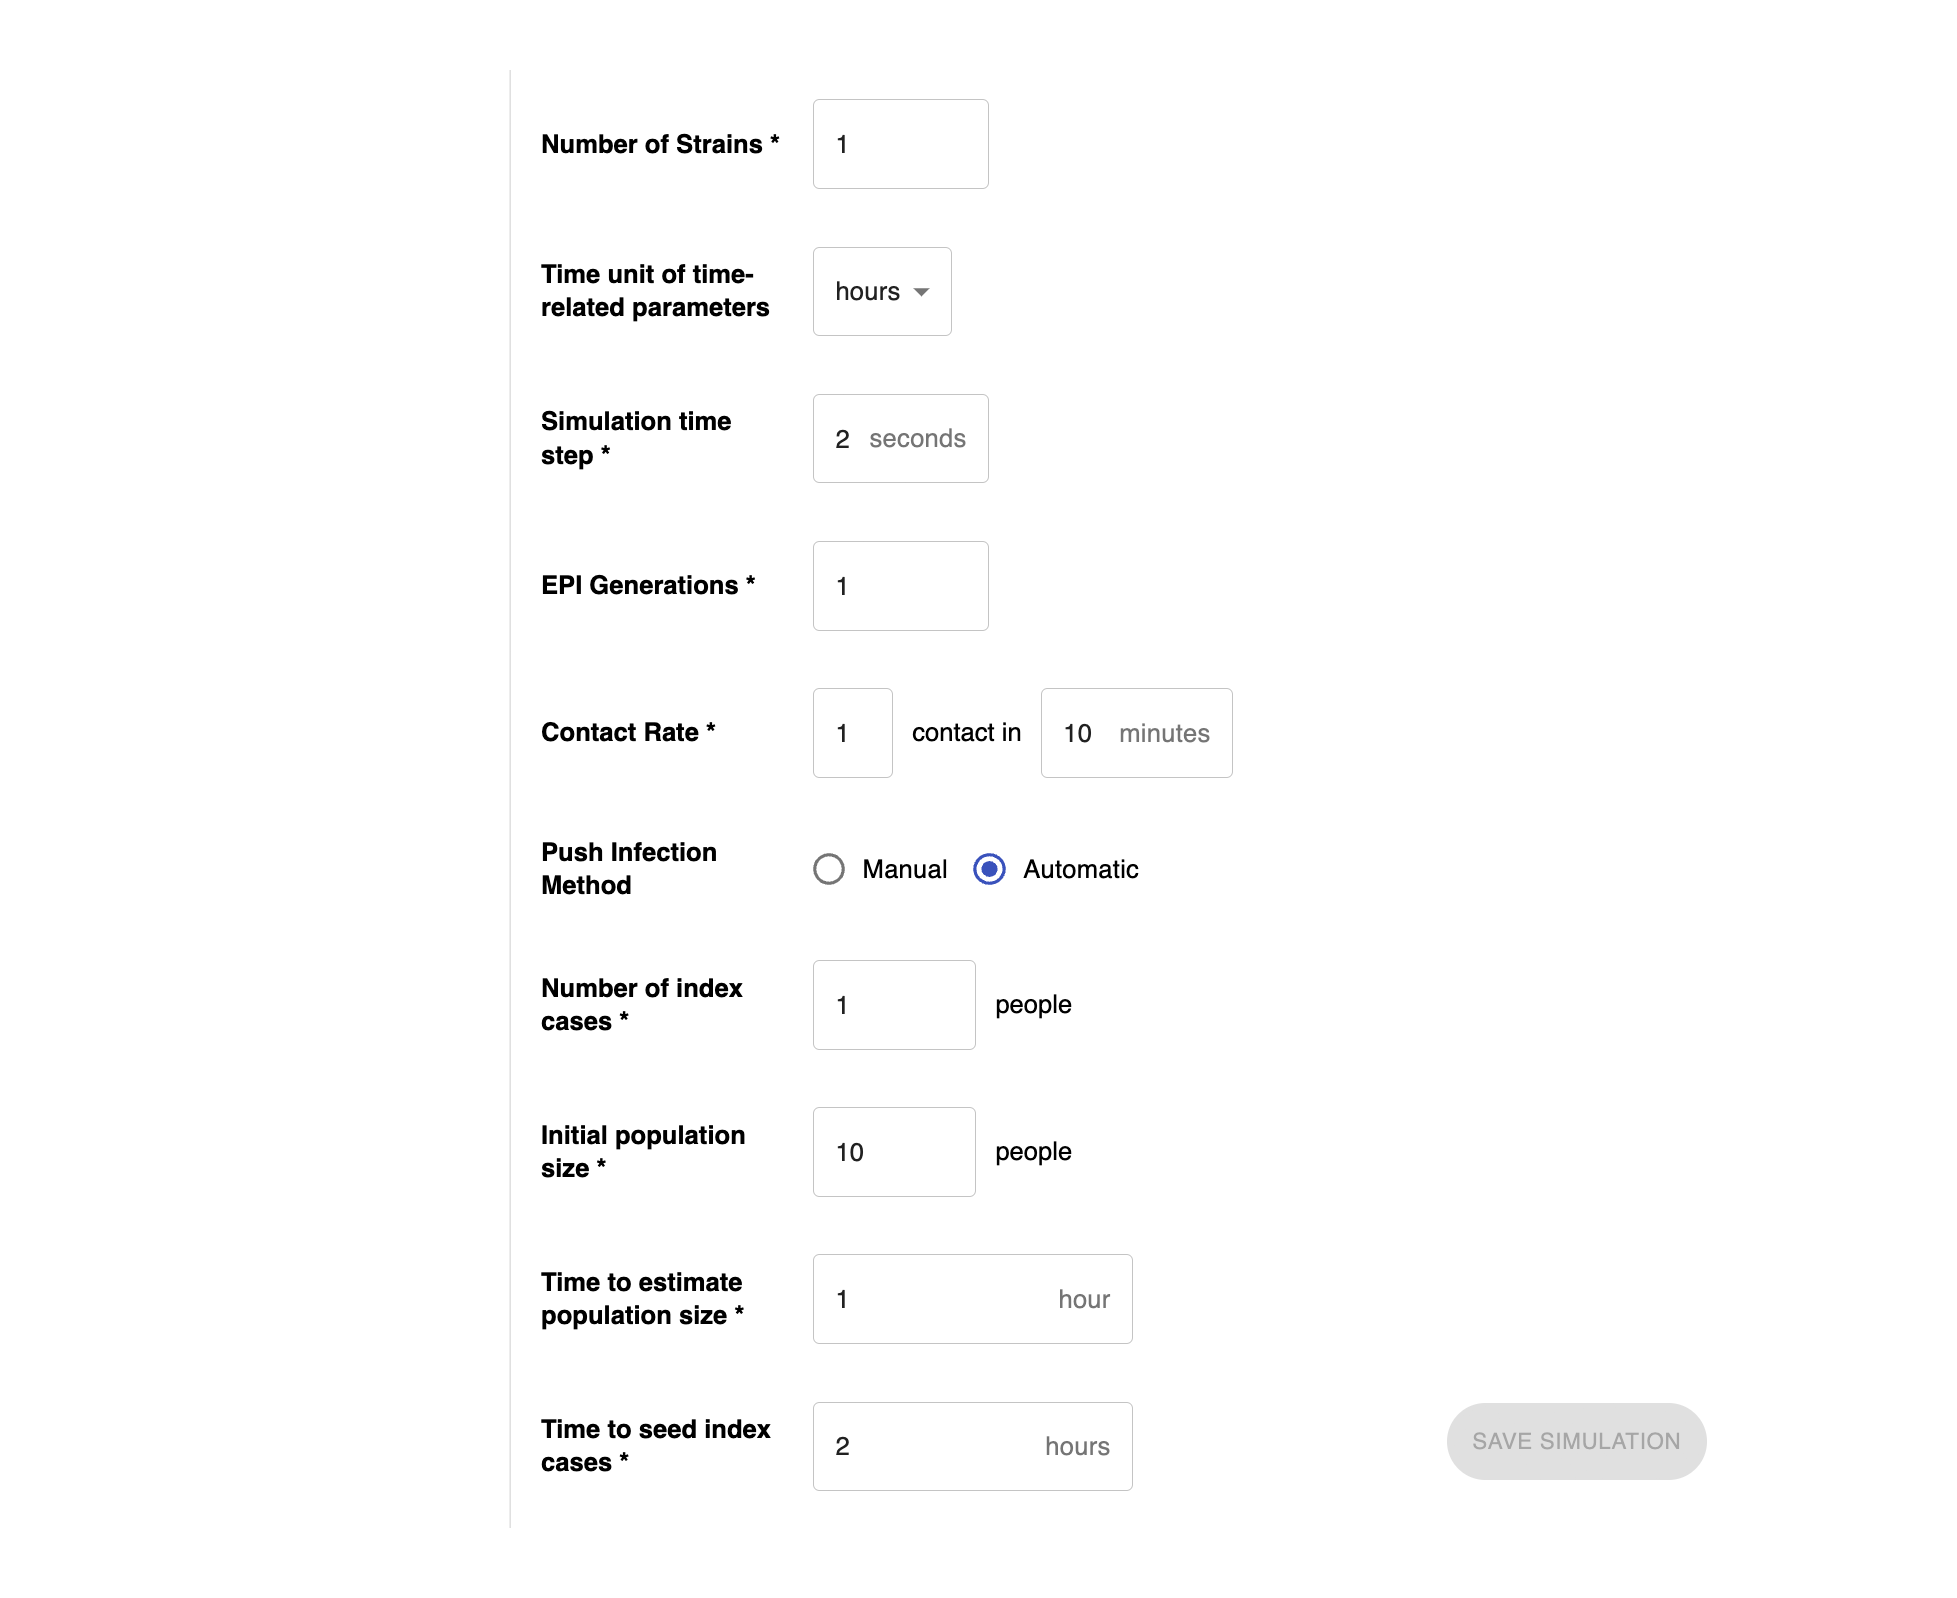
With OO Creator, we condensed a complex set of parameters into the most essential inputs so teachers can create a simulation all on their own. The original creator, seen on the left below, was built with the simulation developers and researchers in mind. As a result, setting up a simulation required expert-level knowledge of the parameters and how the simulation code works.
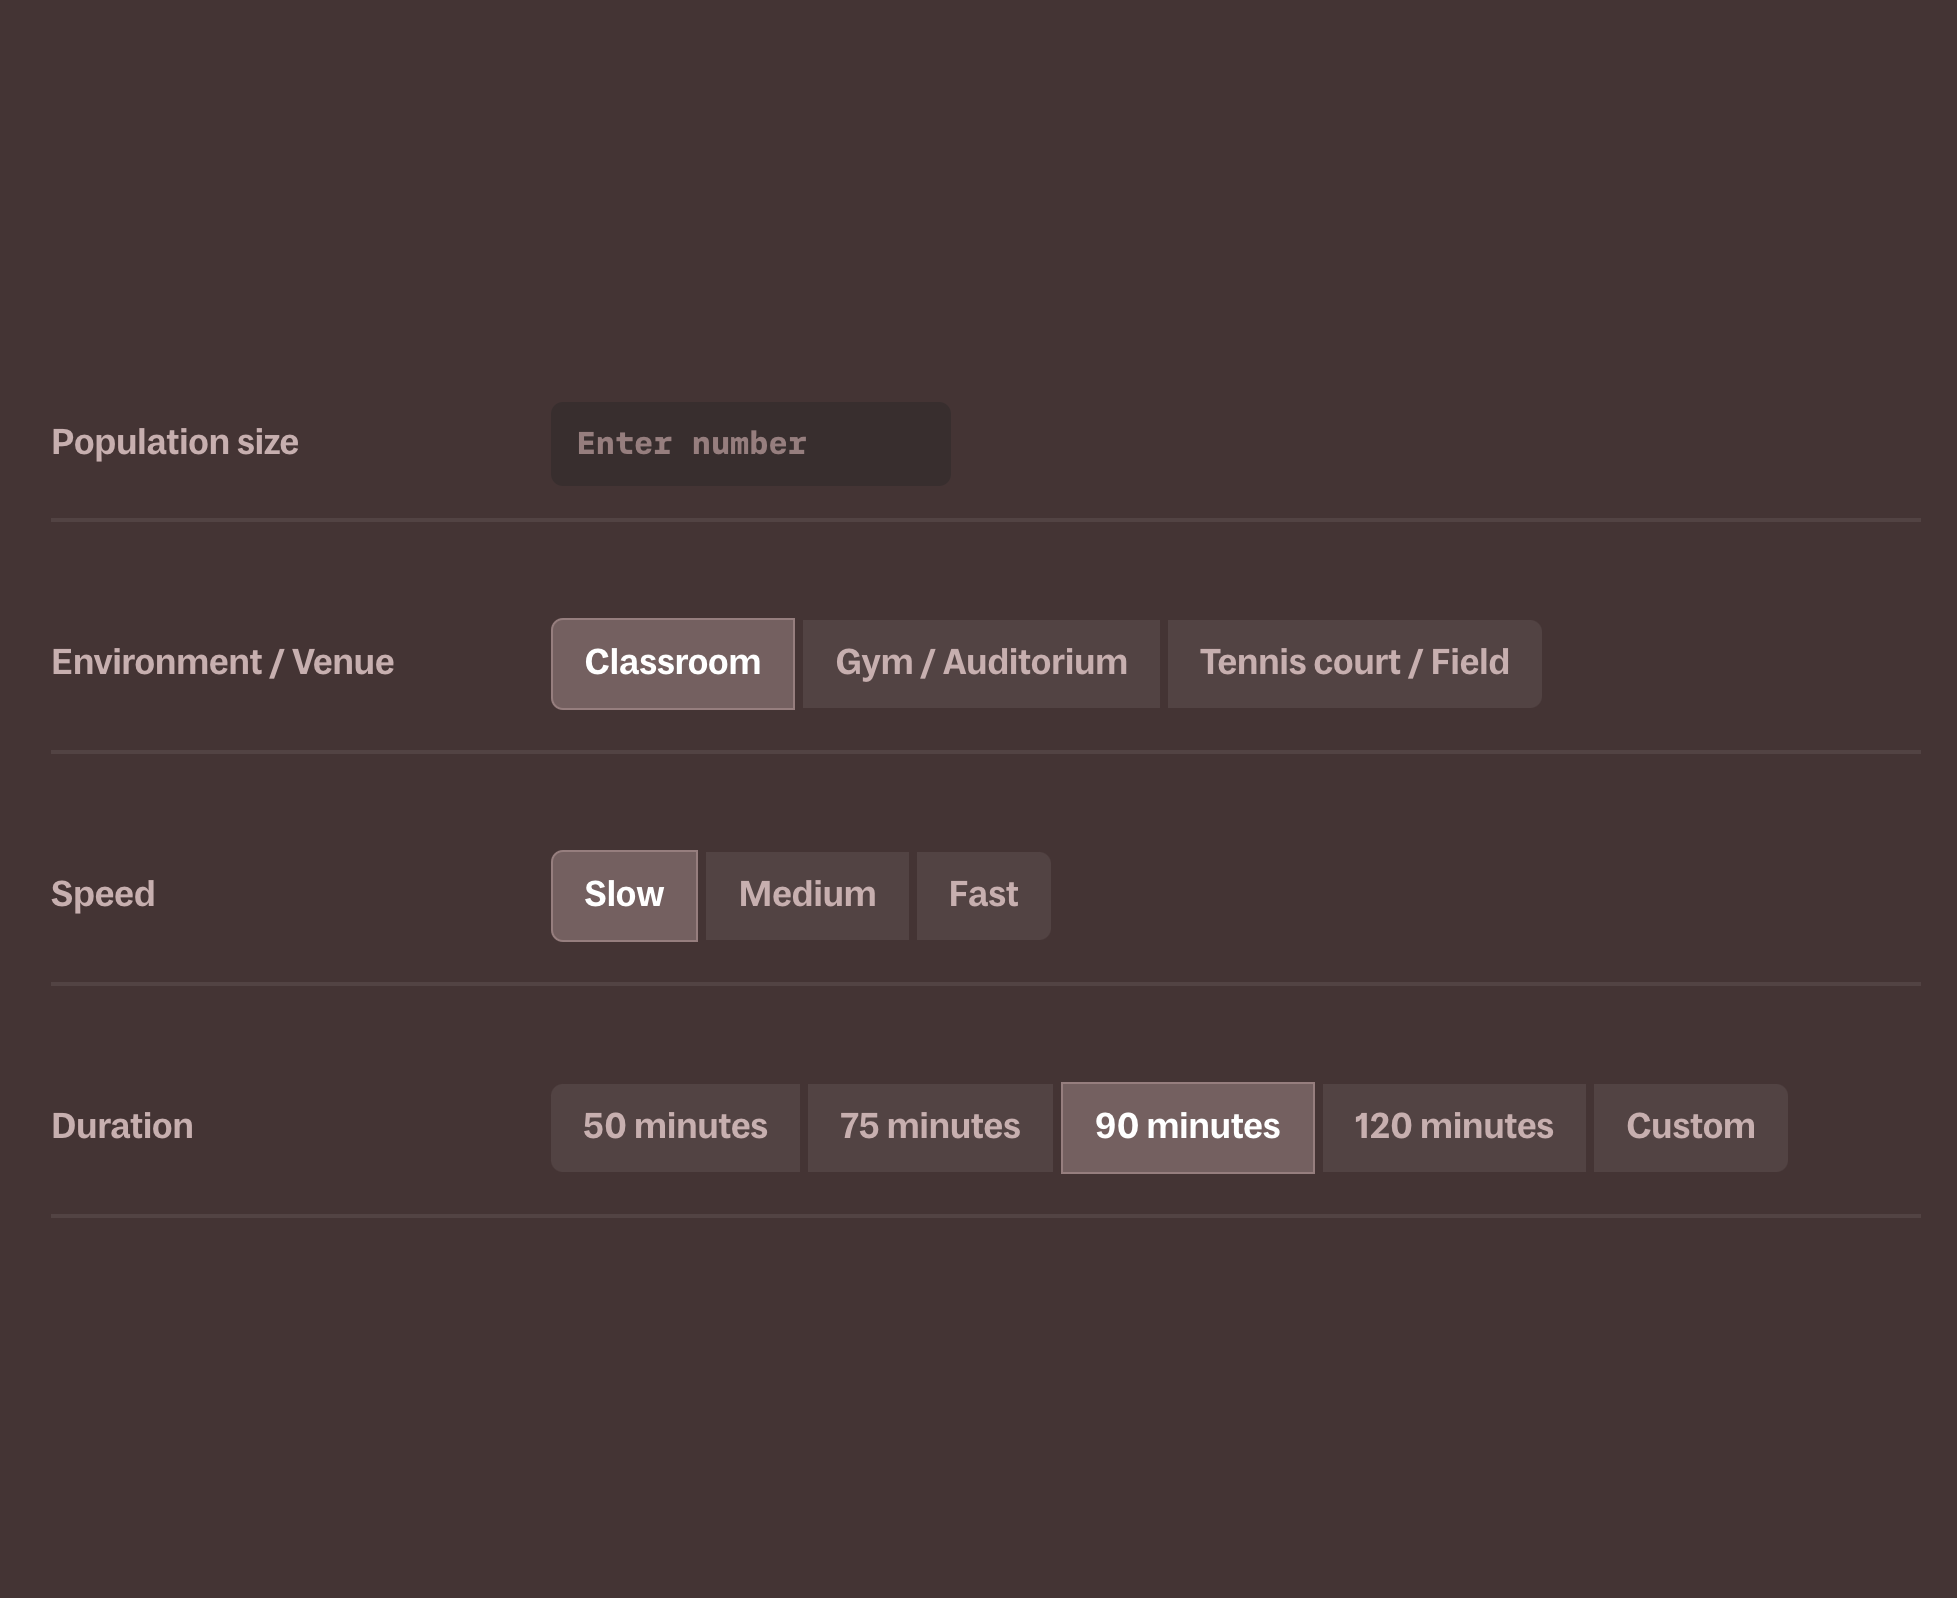
We worked with the original development team to work out what tangible inputs (such as how quickly the teachers want the outbreak to unfold; whether the event was in a classroom, a gym or a field; and the duration of the simulation) the teachers could provide to generate the necessary parameters for the simulation to run without needing that expert-level knowledge. Those were the options exposed to teachers and facilitators in the new OO Creater, as seen in the above right screen.
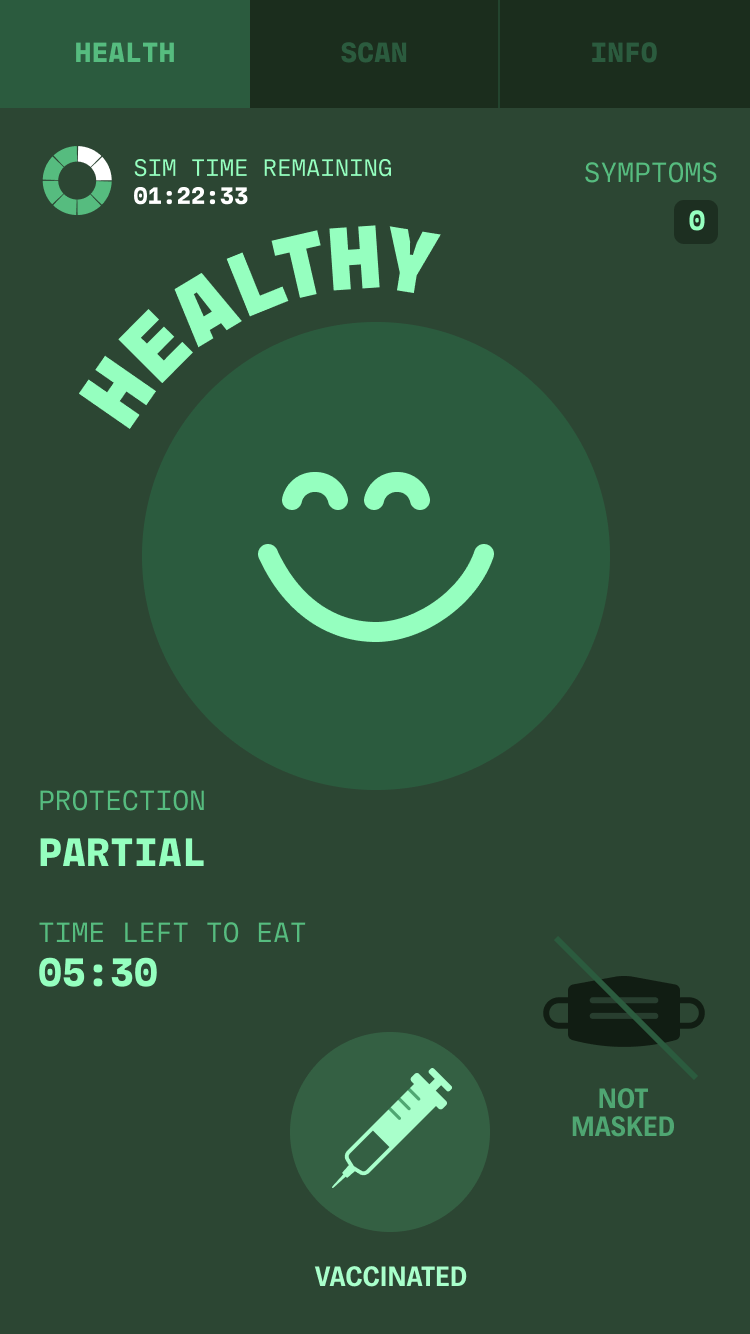
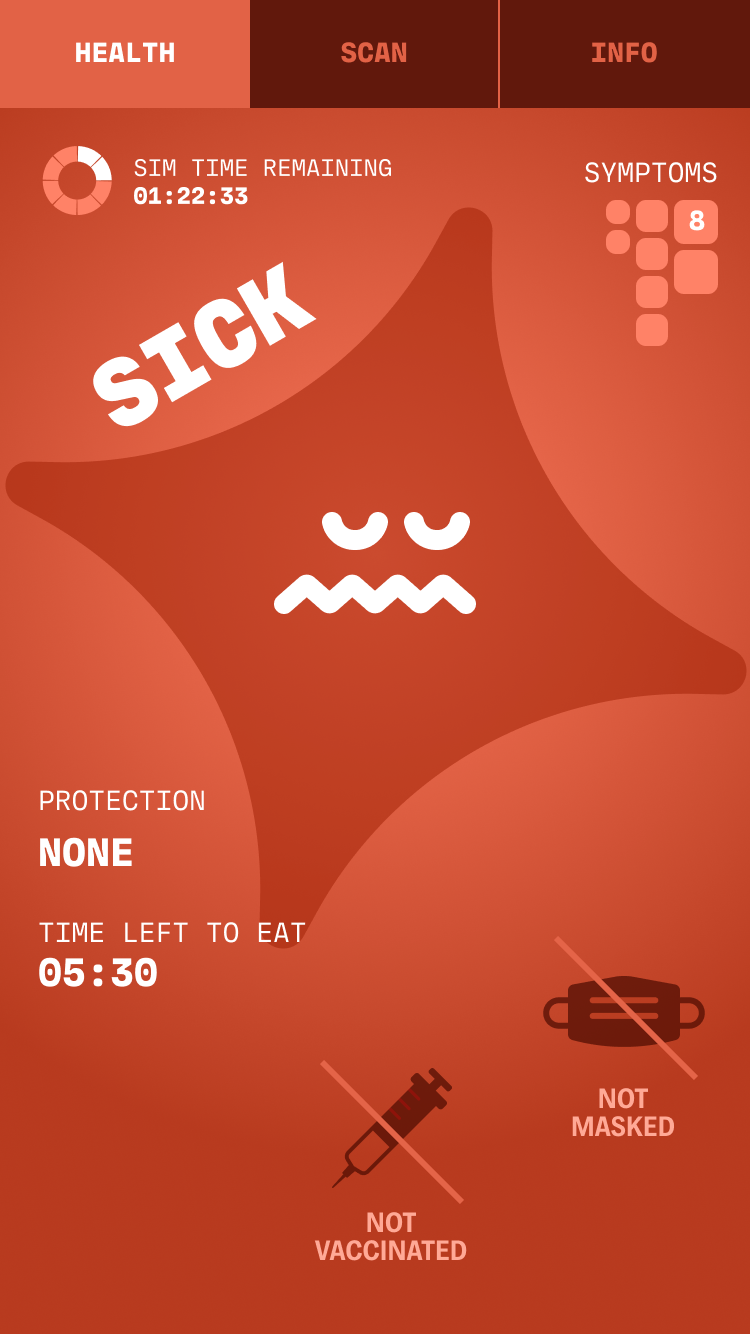
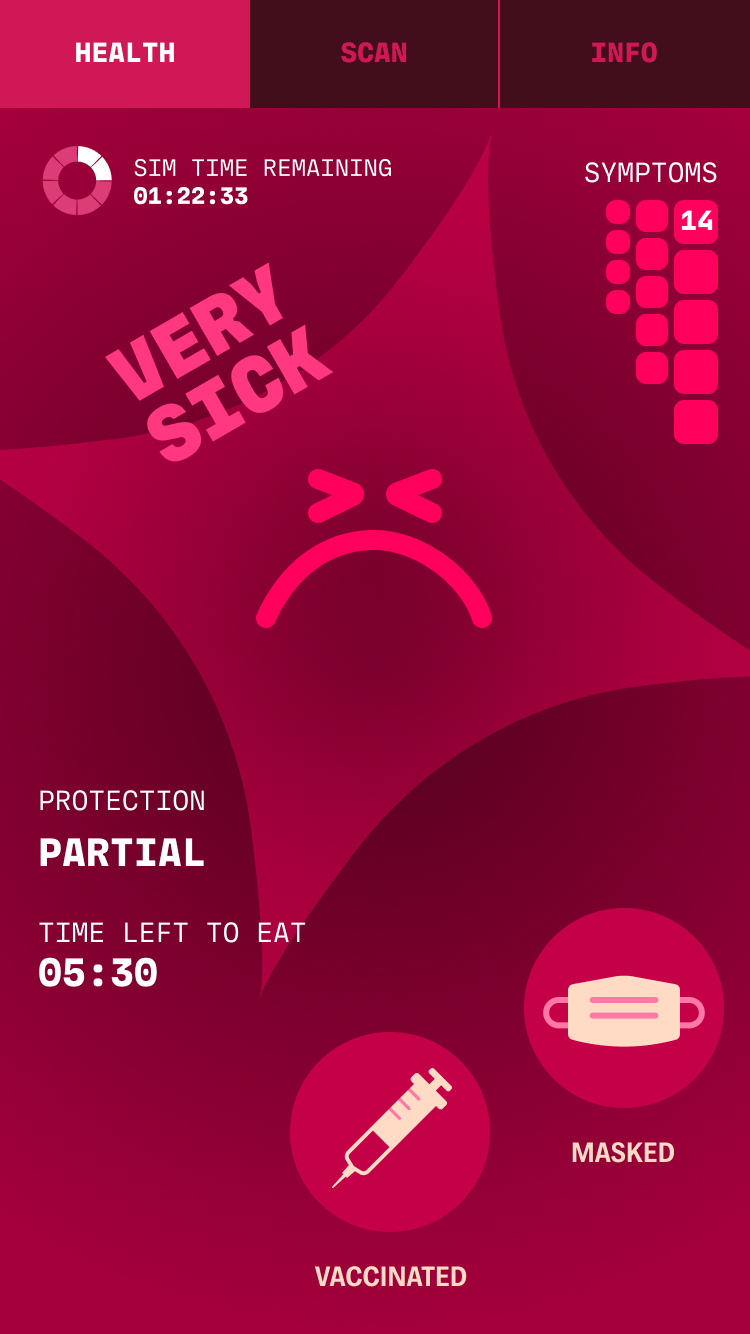
Throughout the simulation, students are represented by “avatars” that are susceptible to infection. In a Basic simulation, students can choose to equip their avatar with interventions, such as masks and vaccines, by scanning QR codes via the mobile app. In an Advanced simulation, students mirror real-world outbreak responses by roleplaying as frontline and behind-the-scenes workers — including government officials, biomedical researchers, healthcare workers and public health officials.
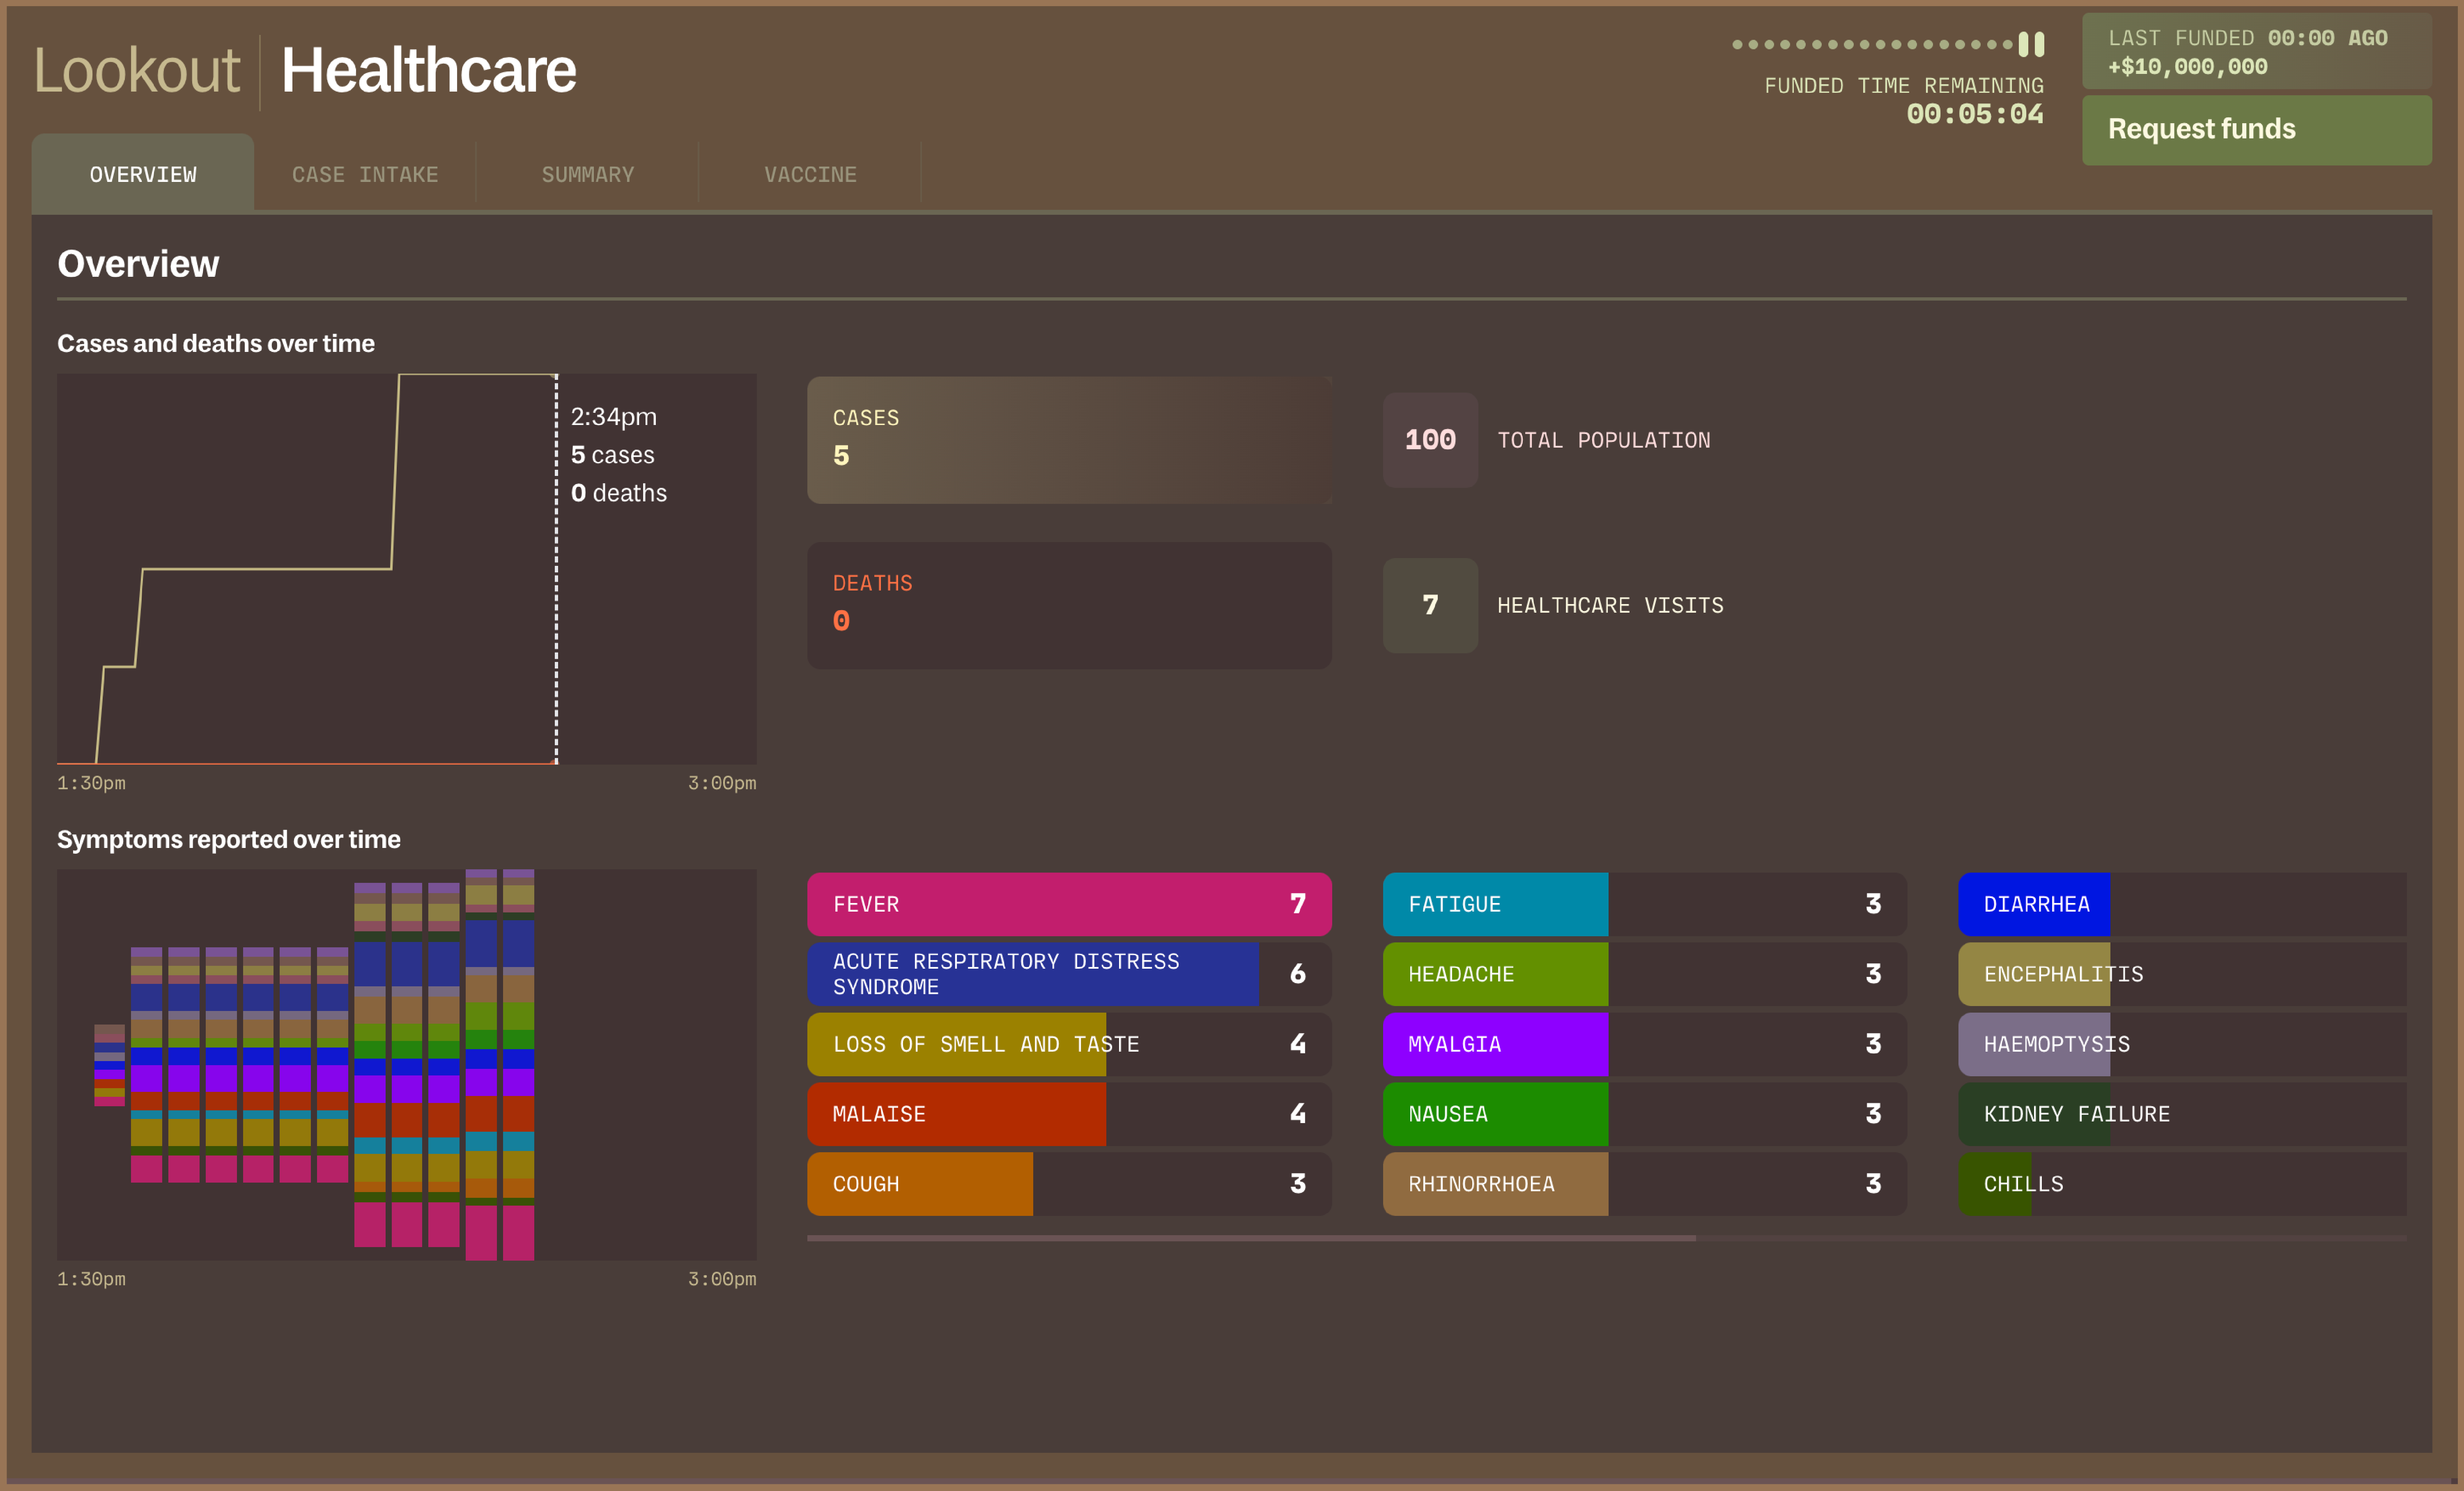
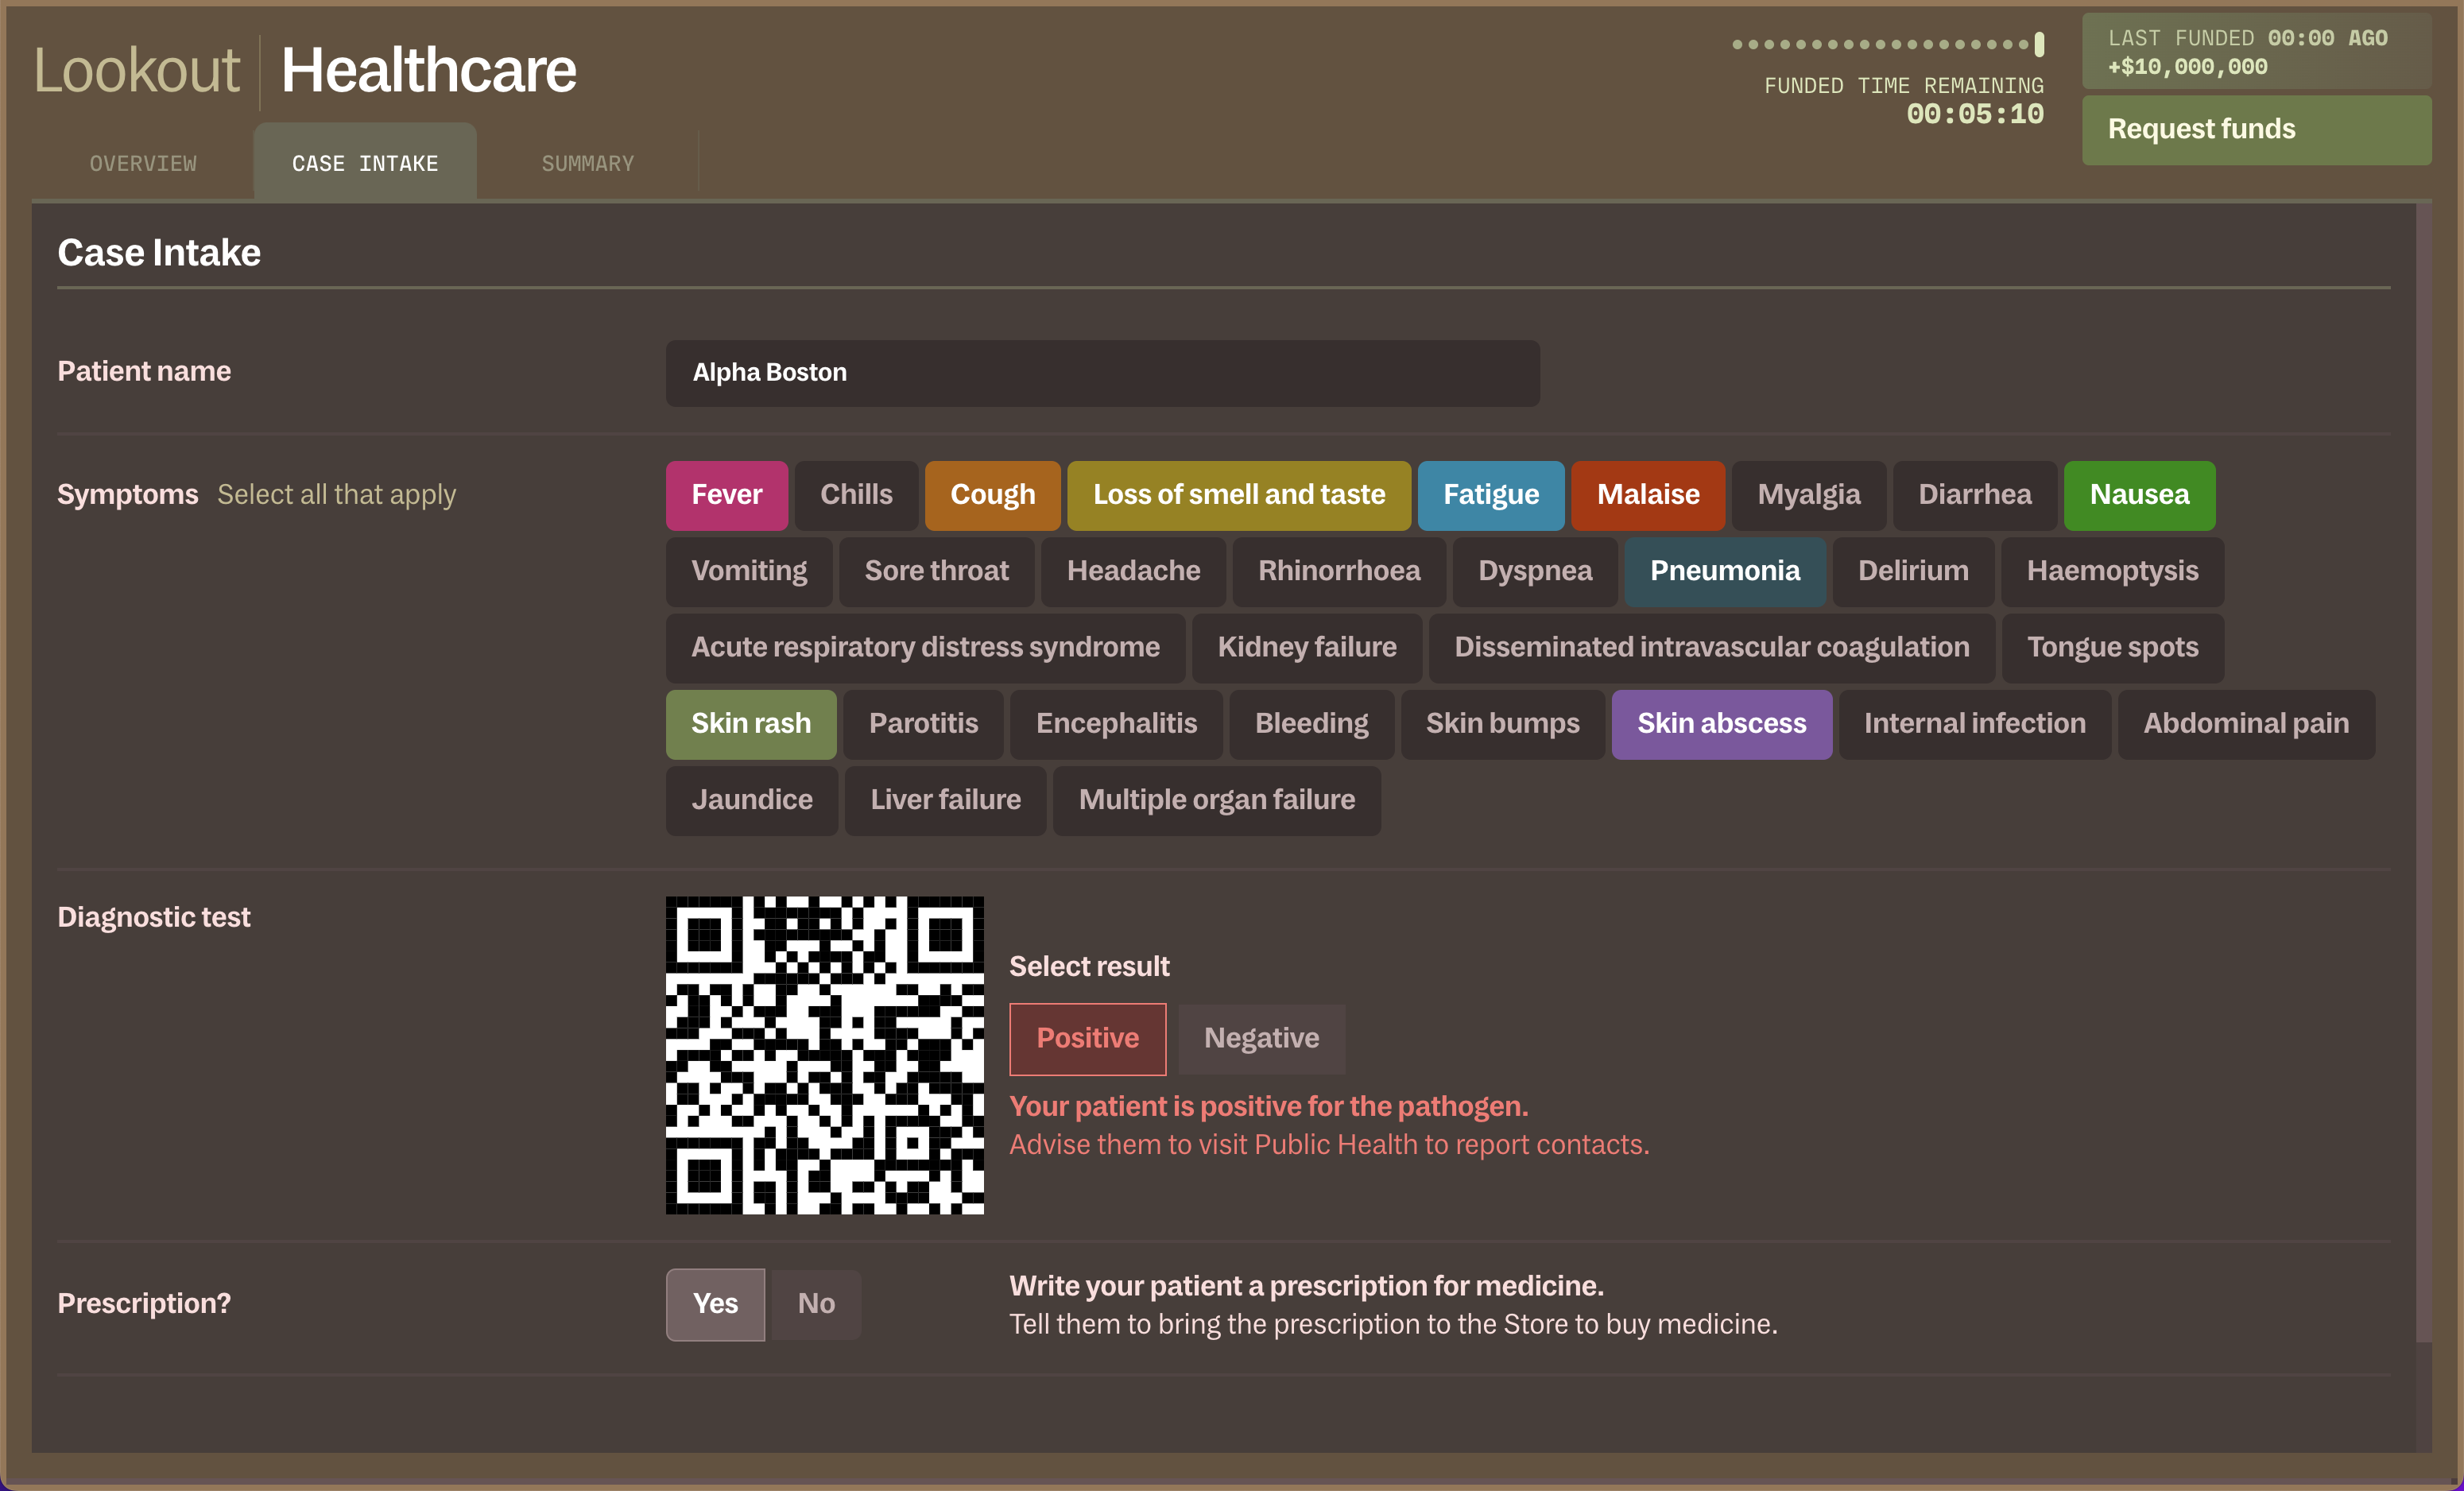
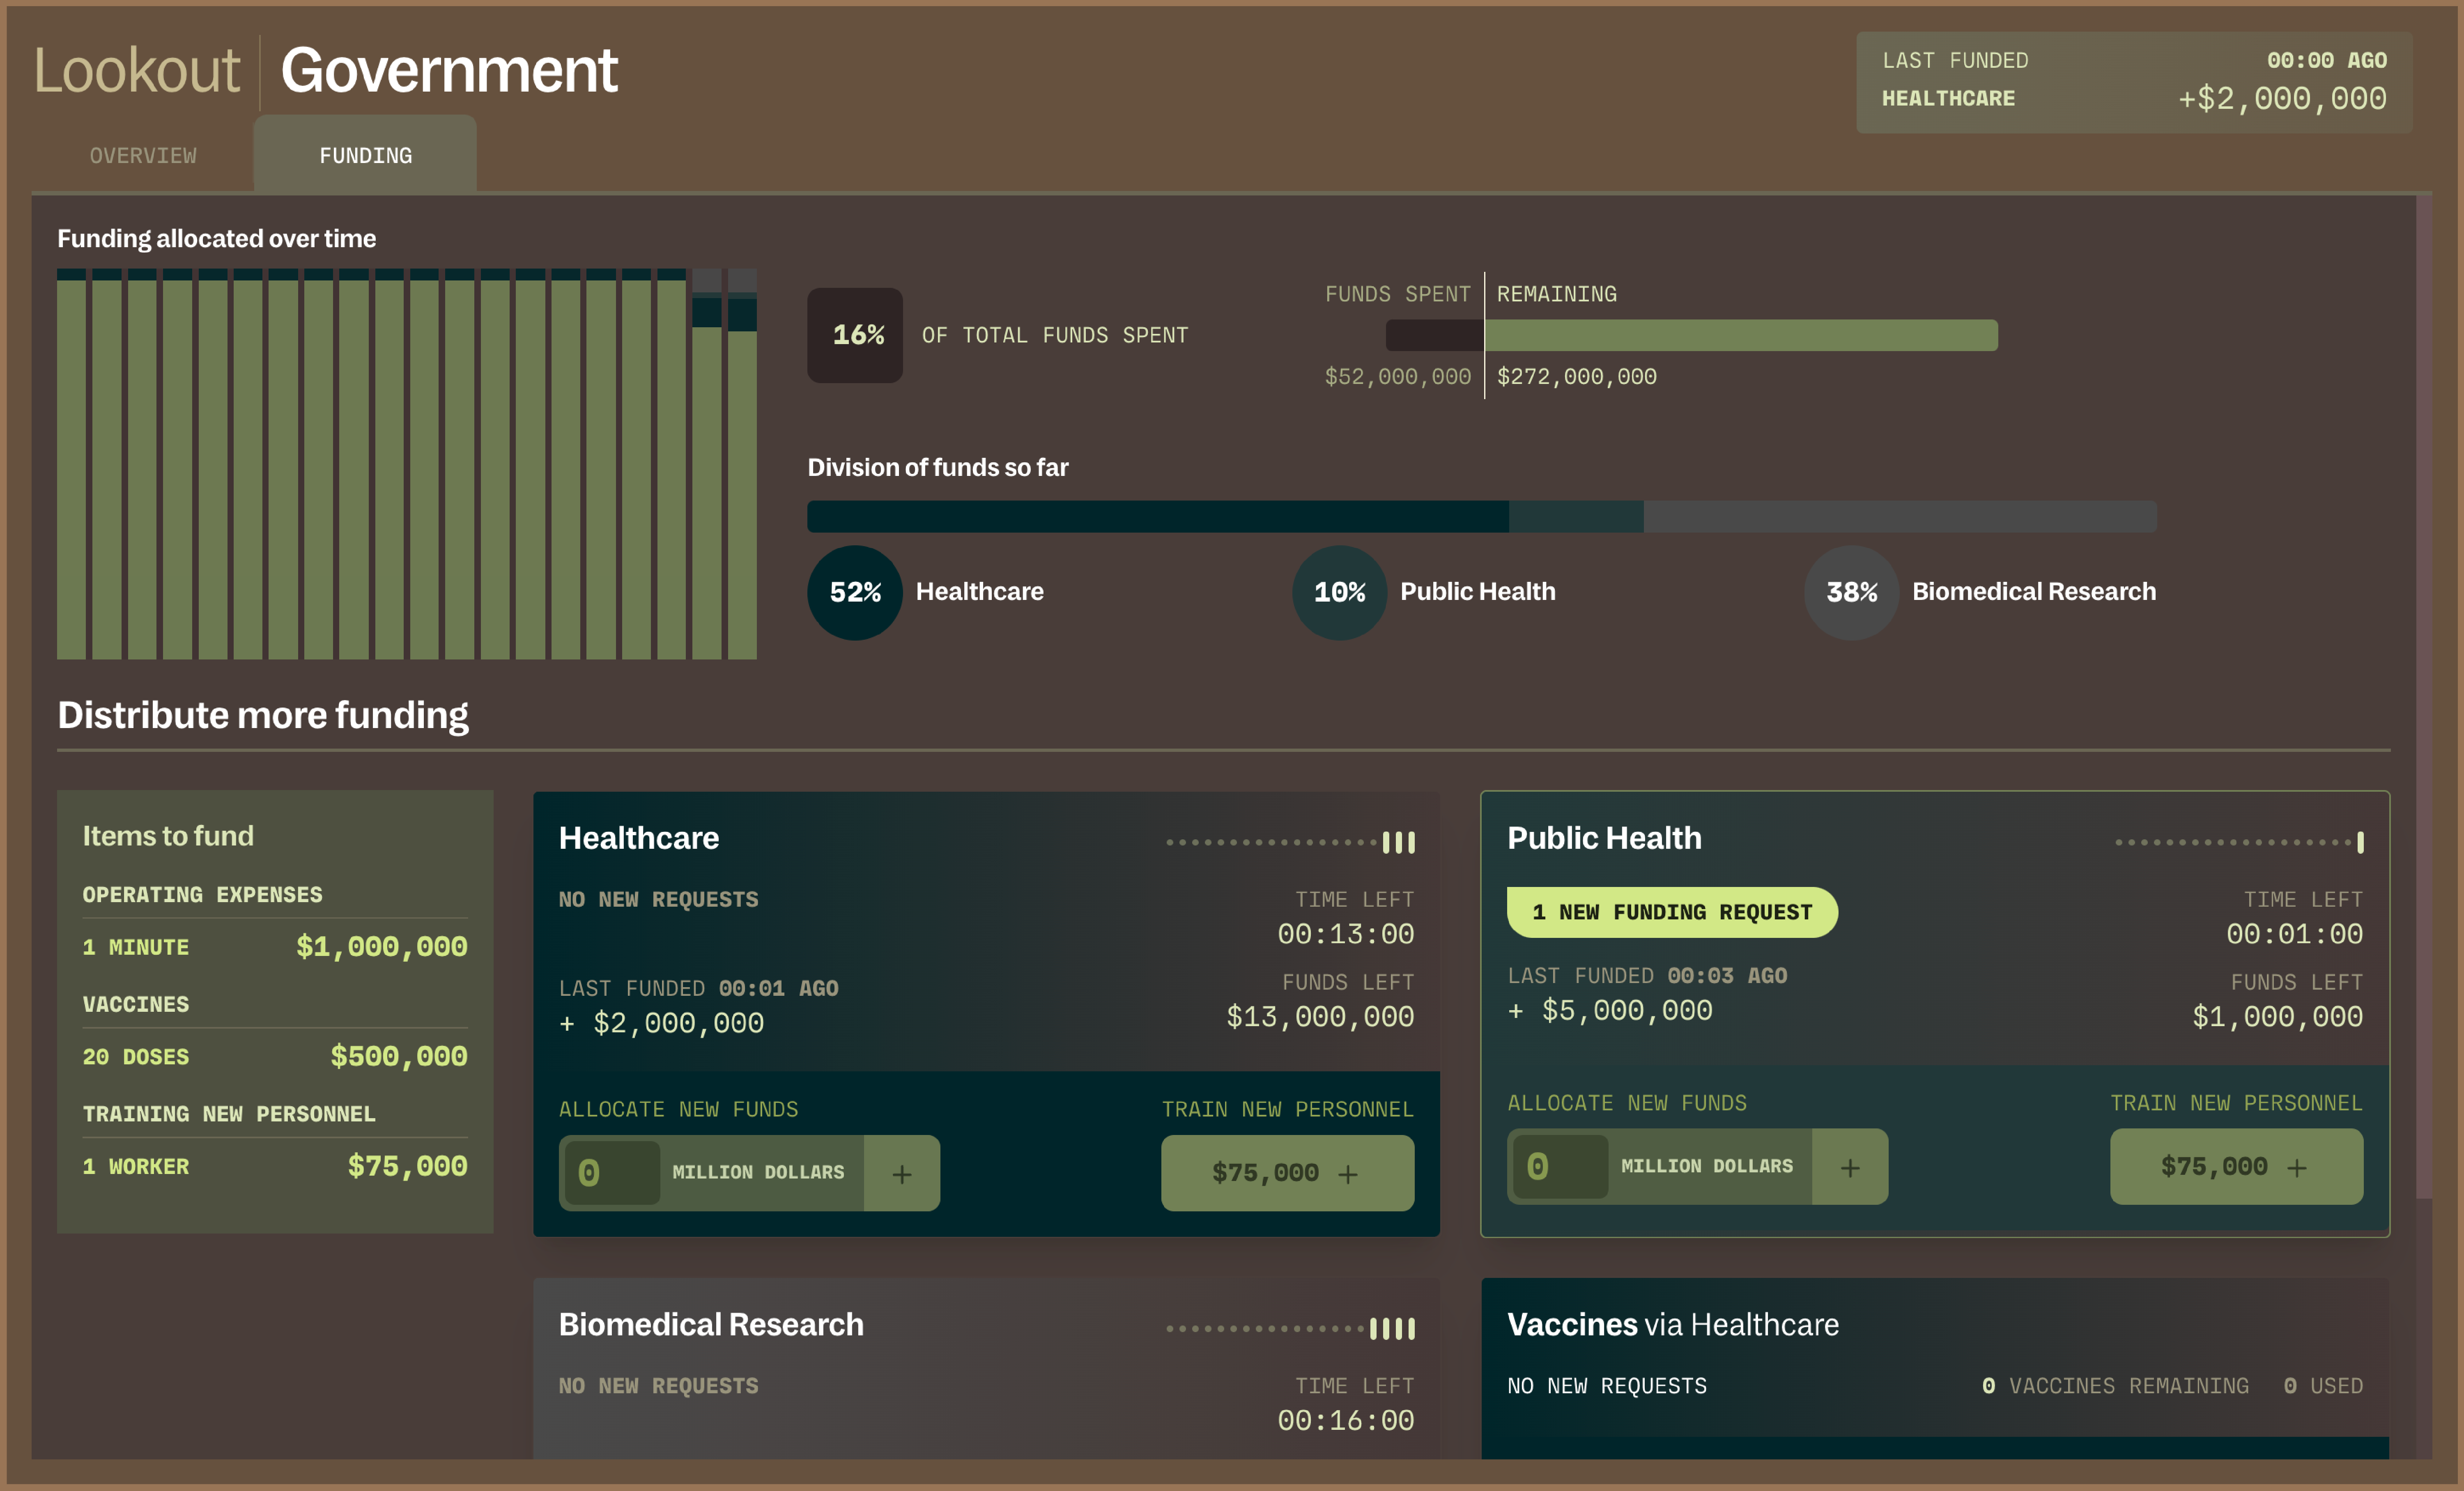
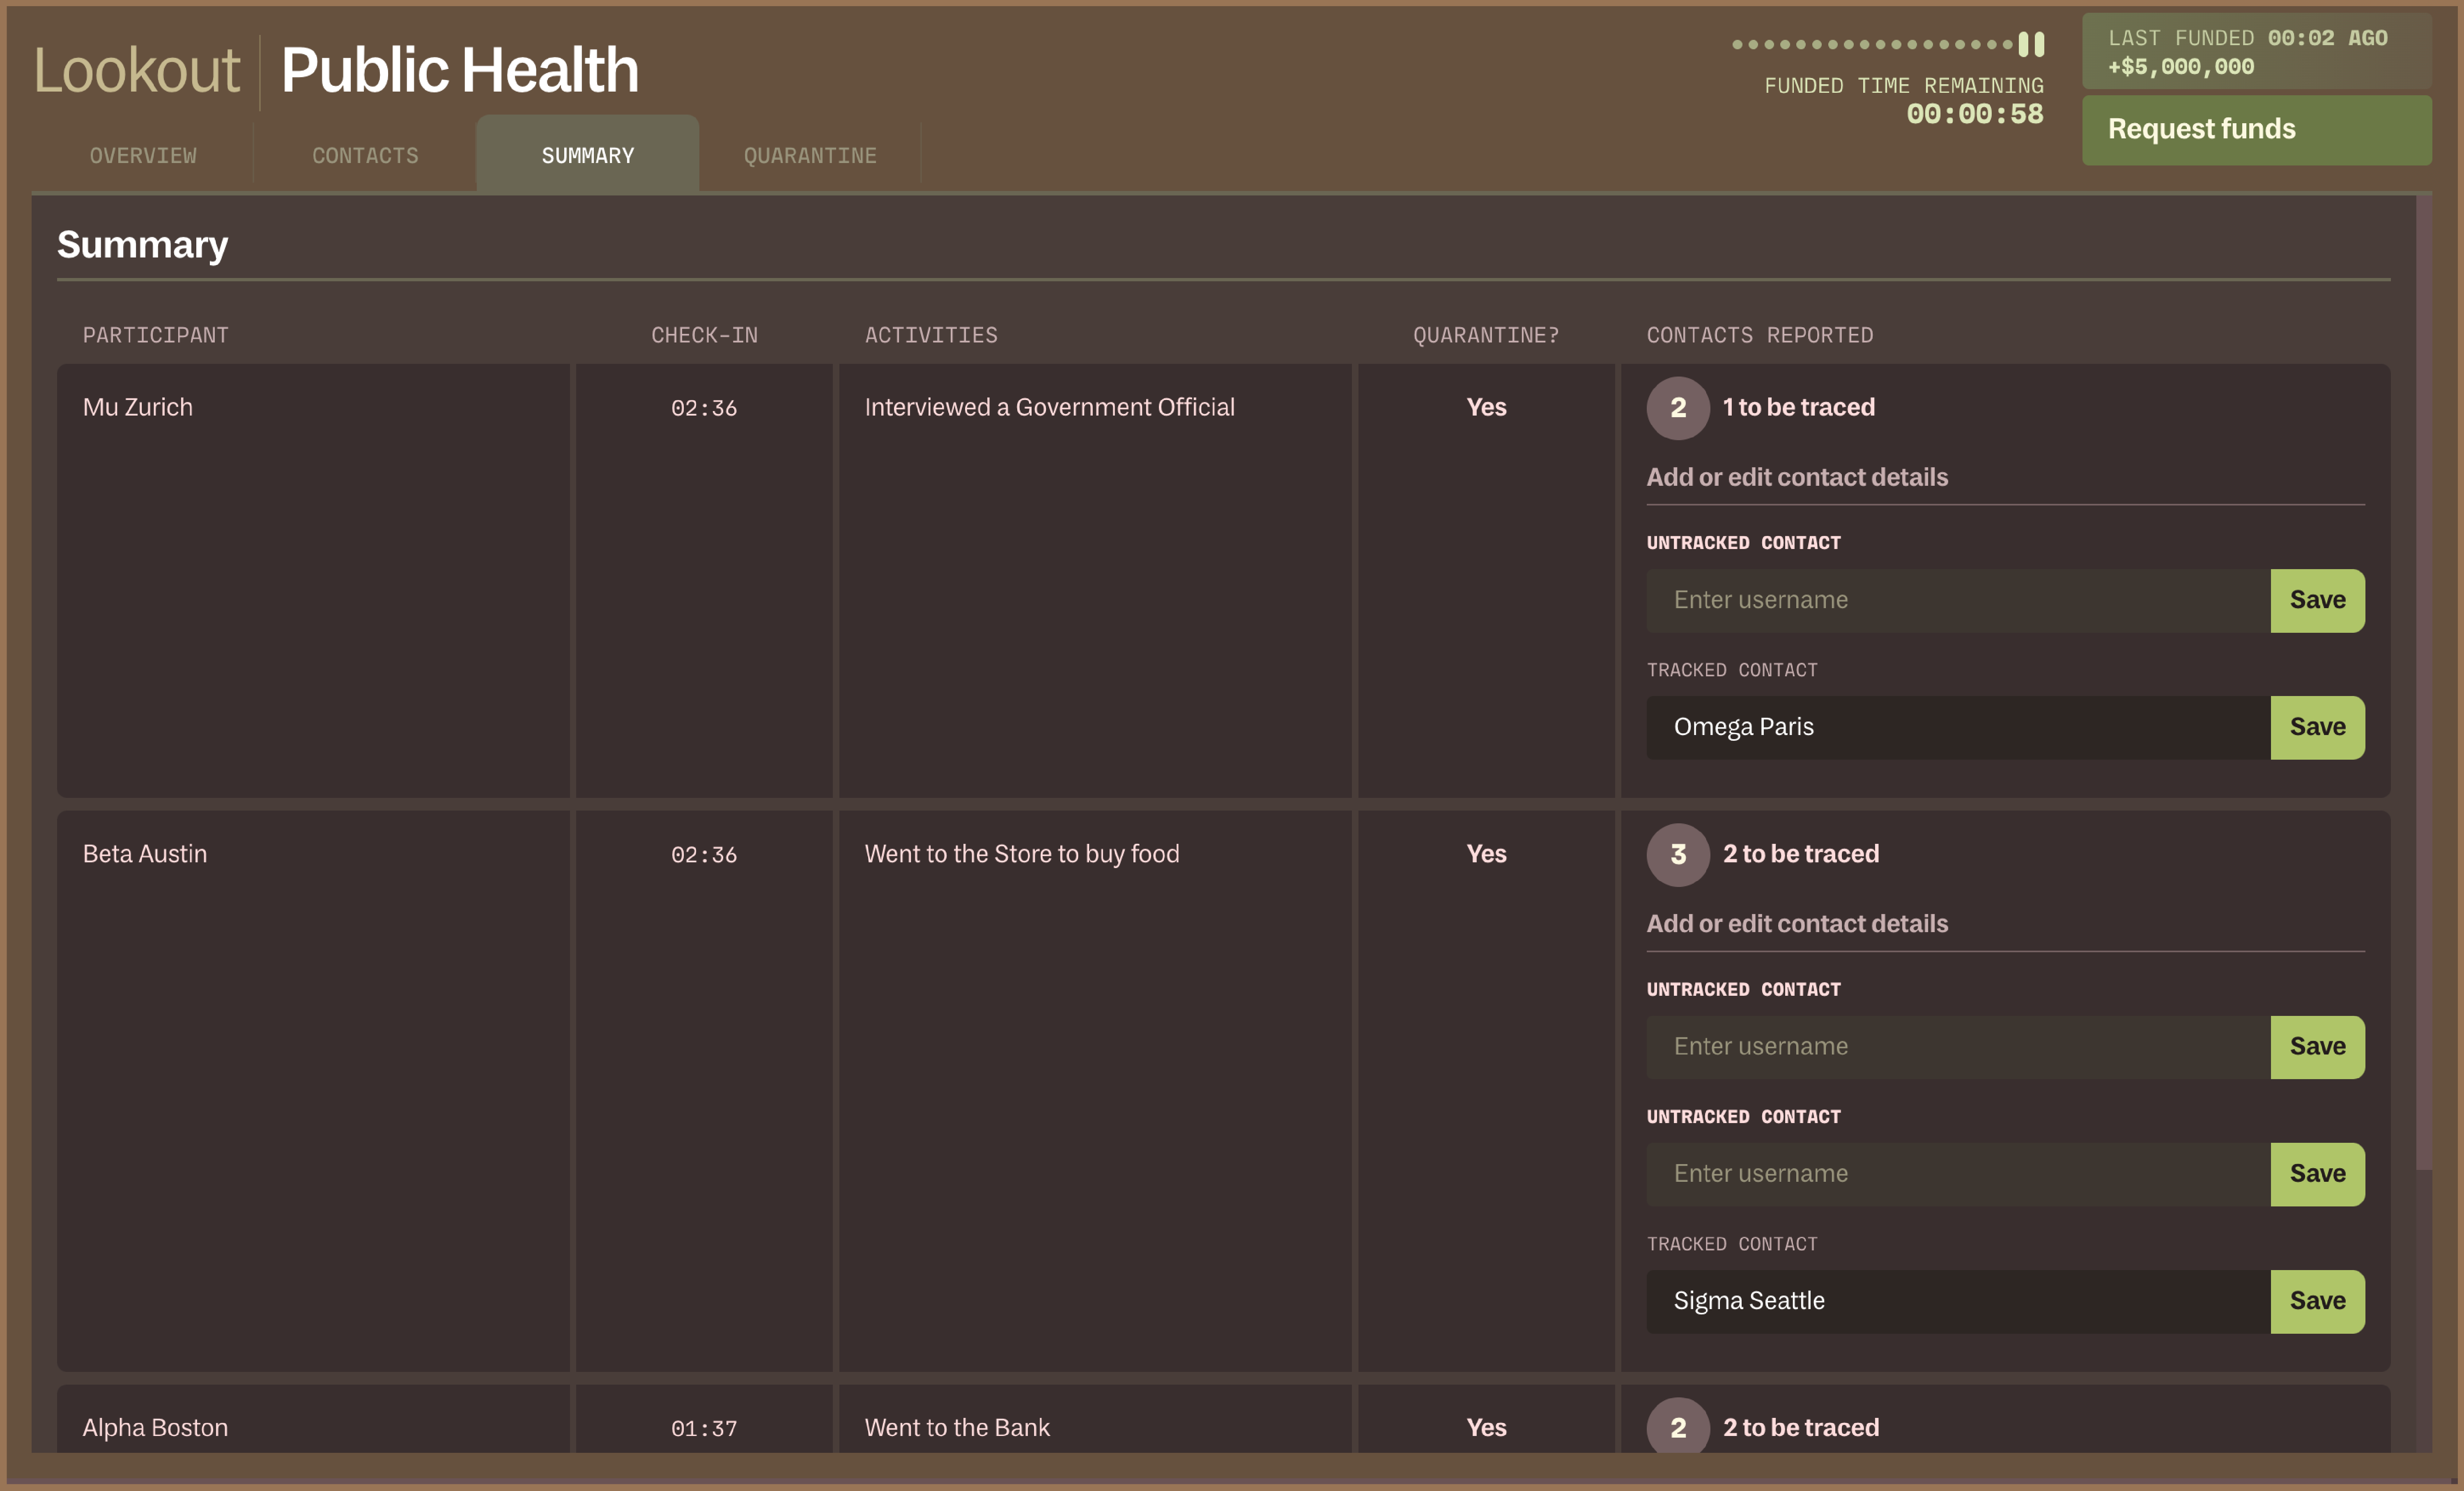
Modeled after our real-life outbreak response platform, OO Lookout is the platform we built for students to fulfill their duties as different frontline workers in the immersive simulations. Each role has their own Lookout interface tailored to their specific needs. Simulation data — such as symptom tracking, case and death counts, and funding allocations — synchronously update across all OO Lookout stations, providing students with real-time access to the information they need to contain the virtual pathogen.
After a simulation has concluded, students and teachers are able to review both participant and Bluetooth collected data in the OO Visualizer, through an interactive set of visualizations. Through discussions facilitated by our team with the key stakeholders on the project, we were able to identify key learning goals for students and synthesize them into compelling views to facilitate post-simulation review and teaching. Below are some learning goals that guided our design:
- Raise general pandemic literacy in students
- Understand and use key outbreak terminology
- Highlight and discuss differences in perception and reality in a pandemic context
- Reflect on the impact of individual action on community outcomes
- Inspire interest in epidemiology, public health, and other related occupations
With the OO Visualizer, teachers can walk students through how the outbreak unfolded, and students can explore and reflect on their own individual actions.
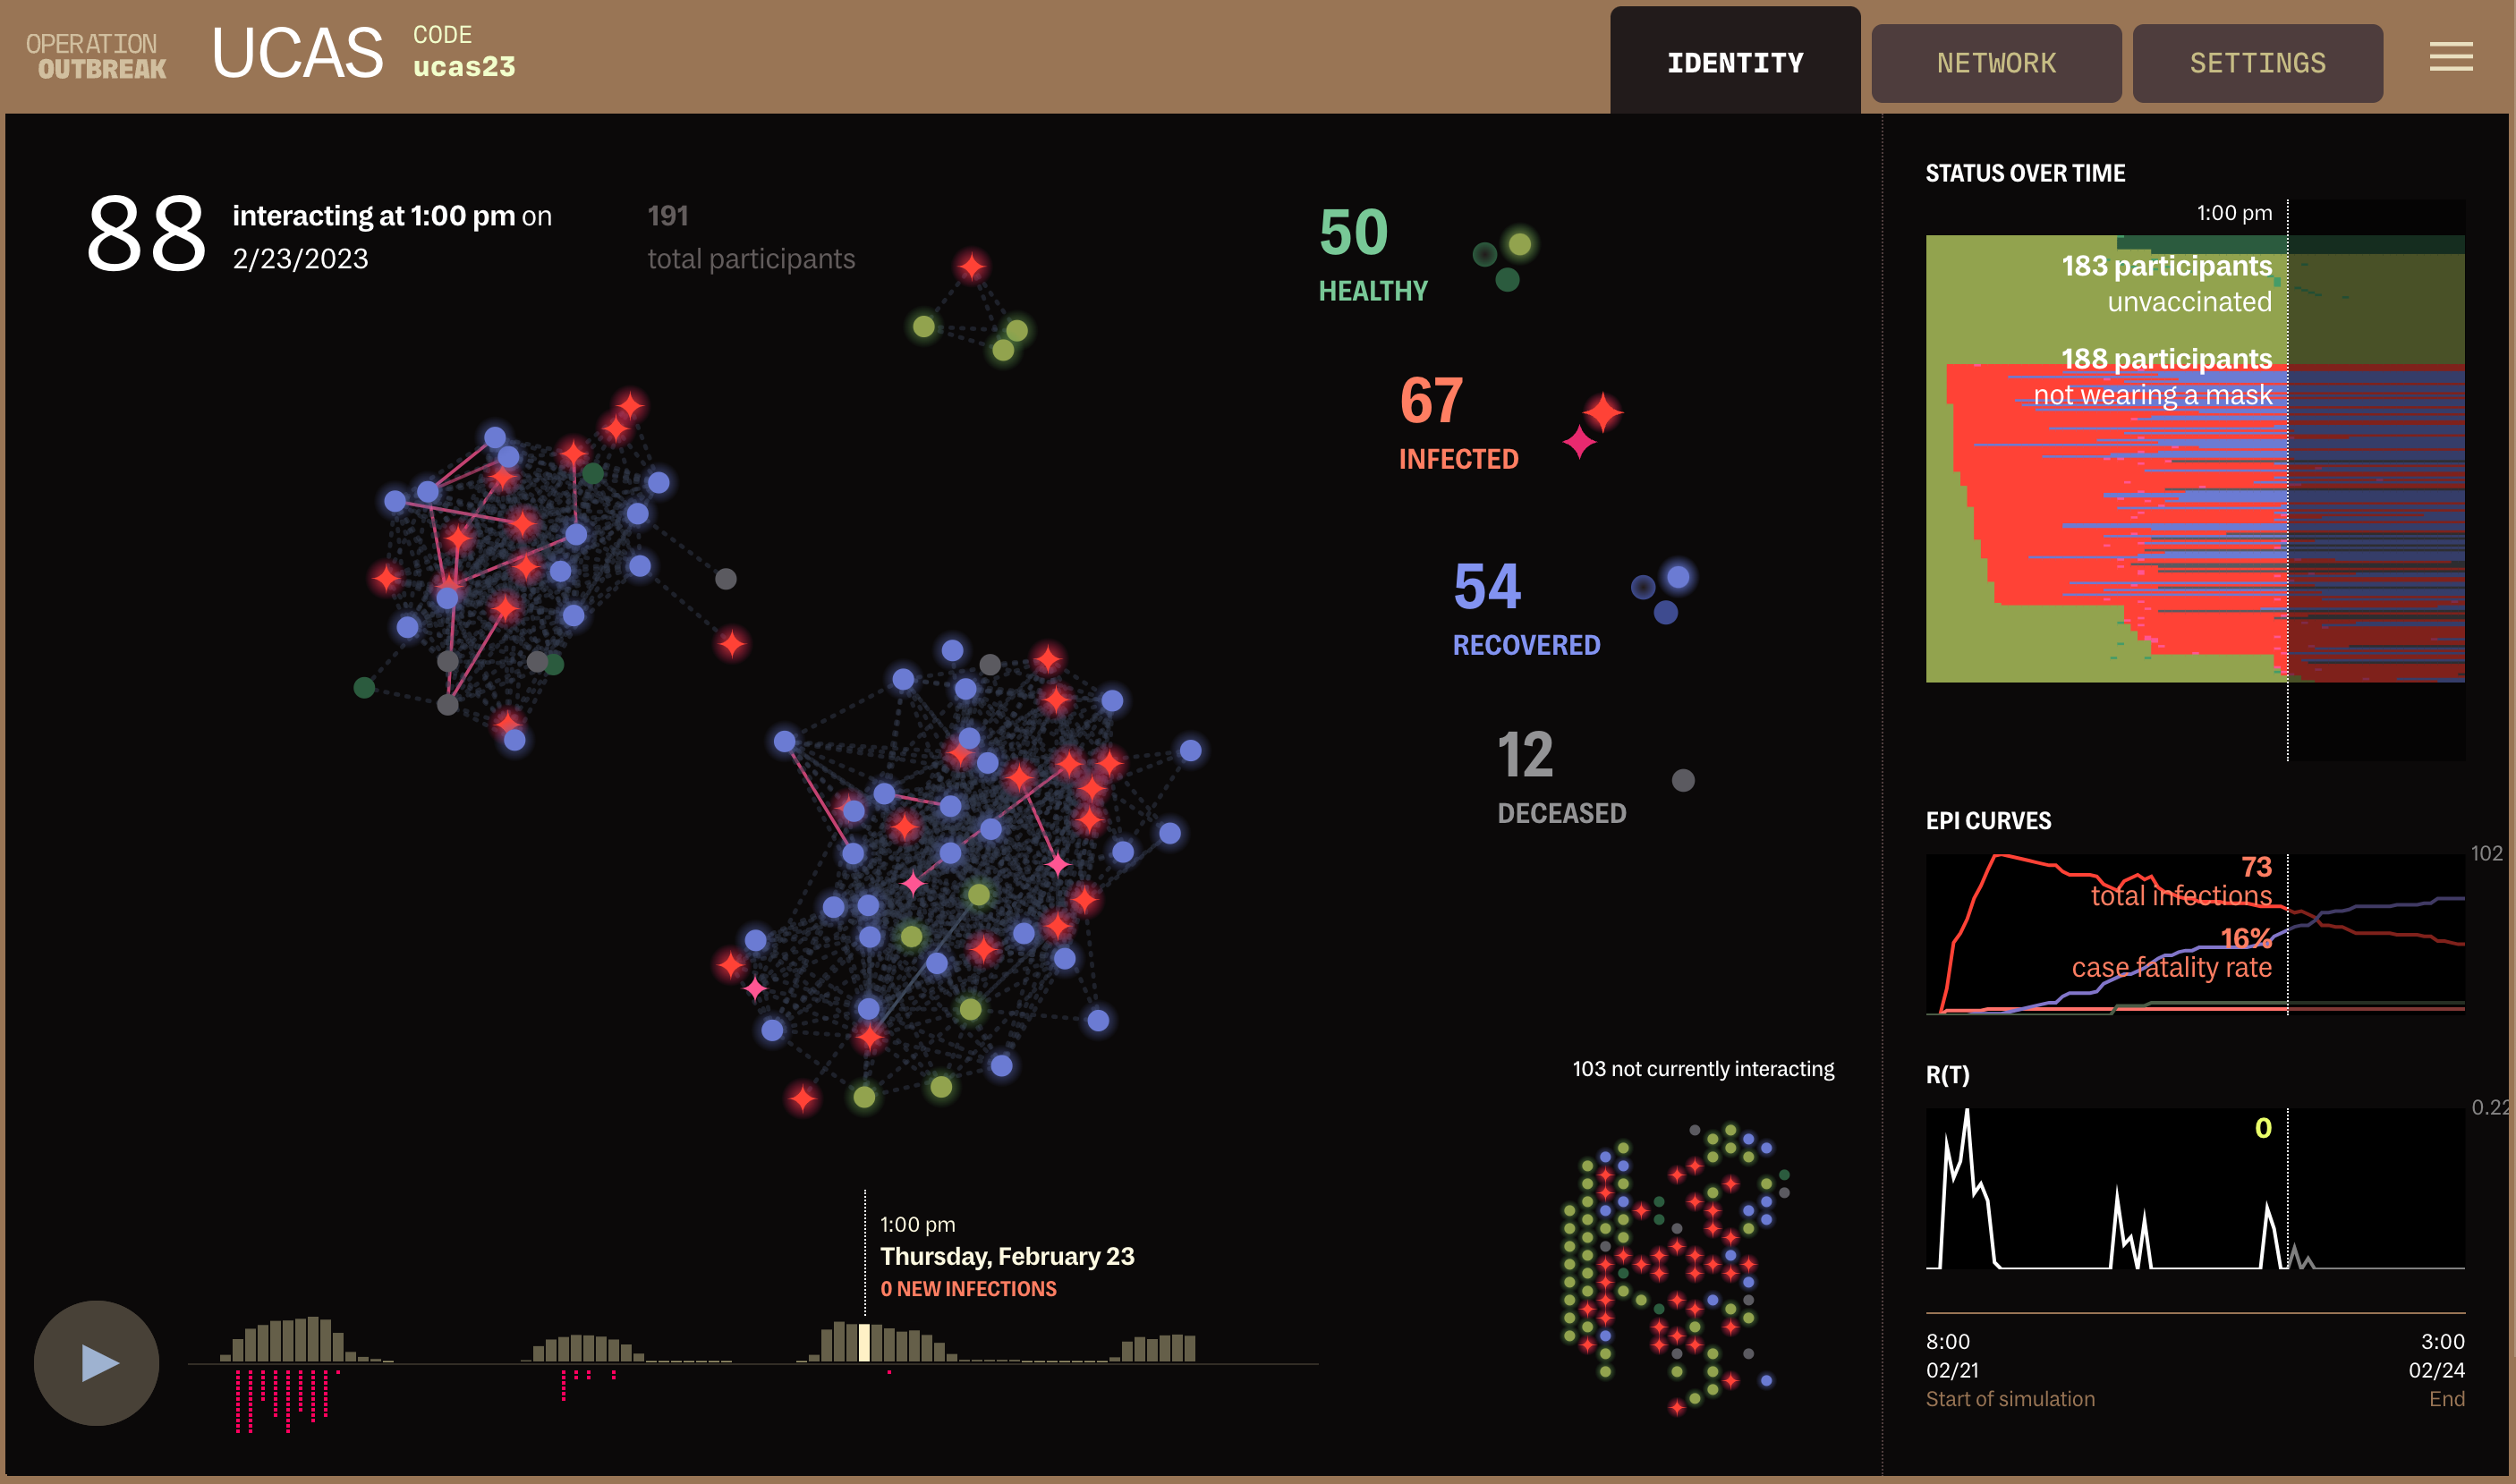
The Overview allows students to review their community’s health over time and play back key moments like cluster activity and super-spreading events to observe how they unfolded. It allows students to see the overall density of activity and how connected everyone was in a way that may not feel as visible during the simulation itself. Key terms and ideas such as the epidemiological curves and R(t) are also presented here.
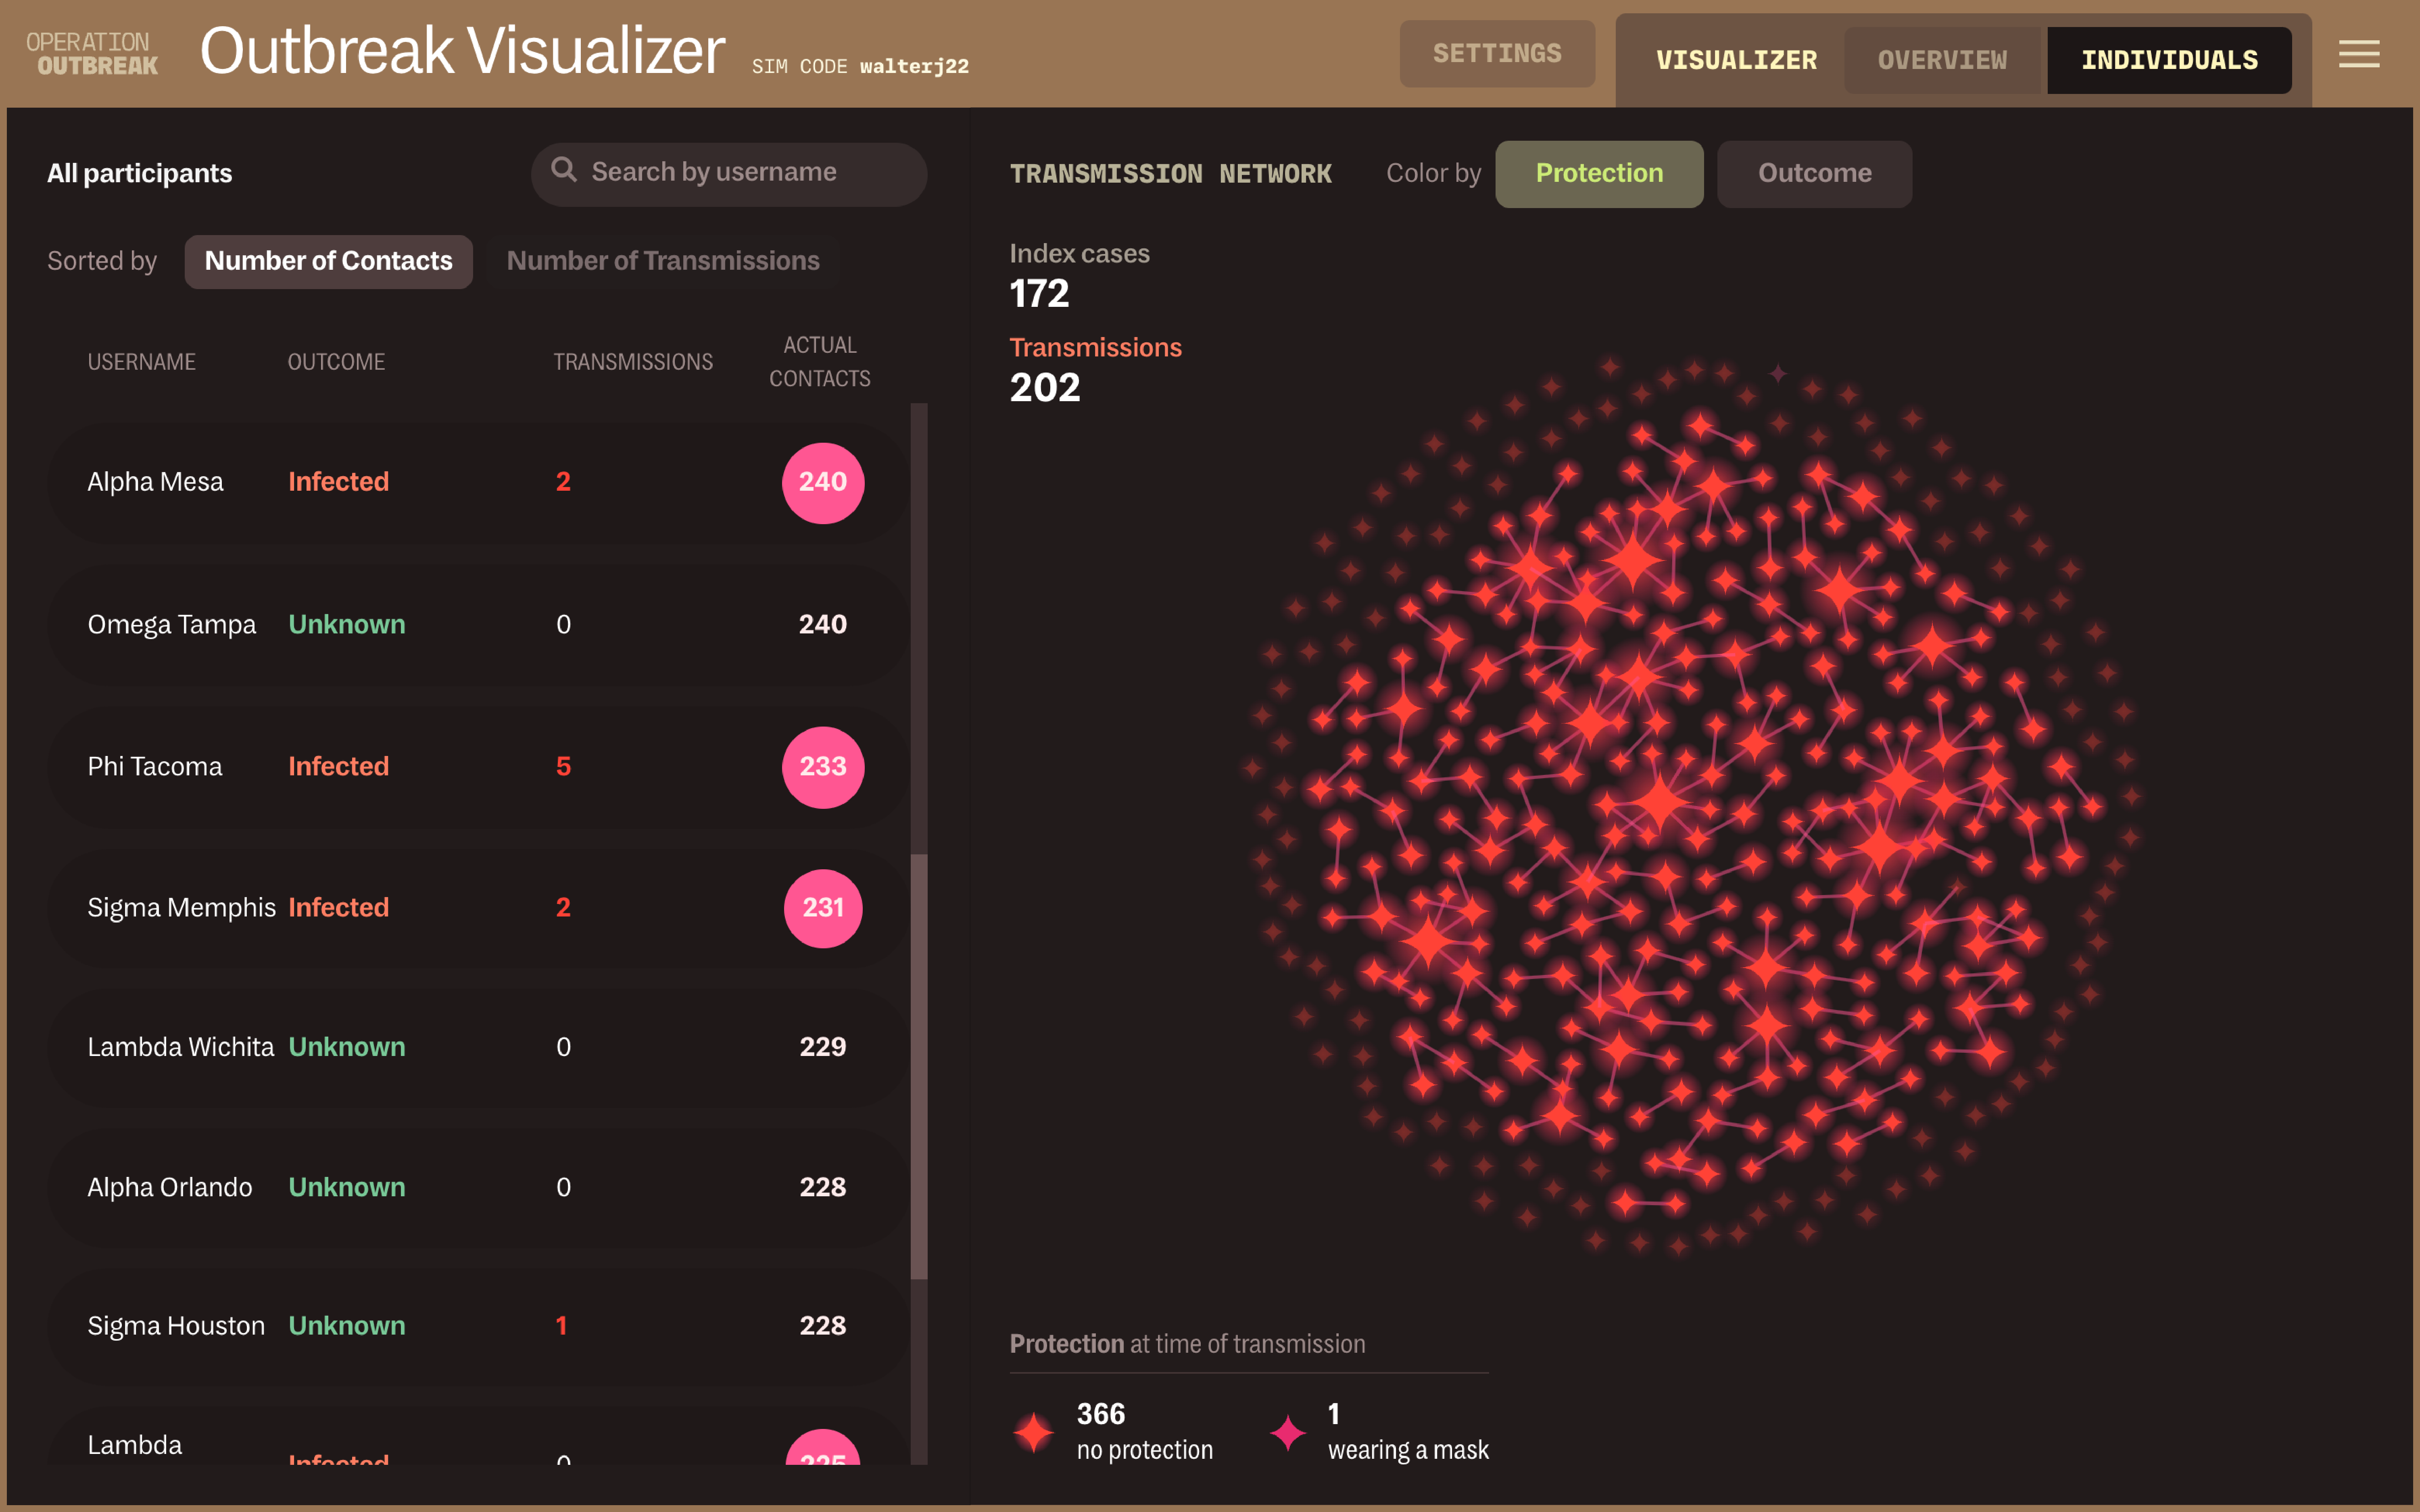
In the Transmission Network, students can gain deeper insight into how the virus spread person-to-person, and the effectiveness of certain interventions such as masks.
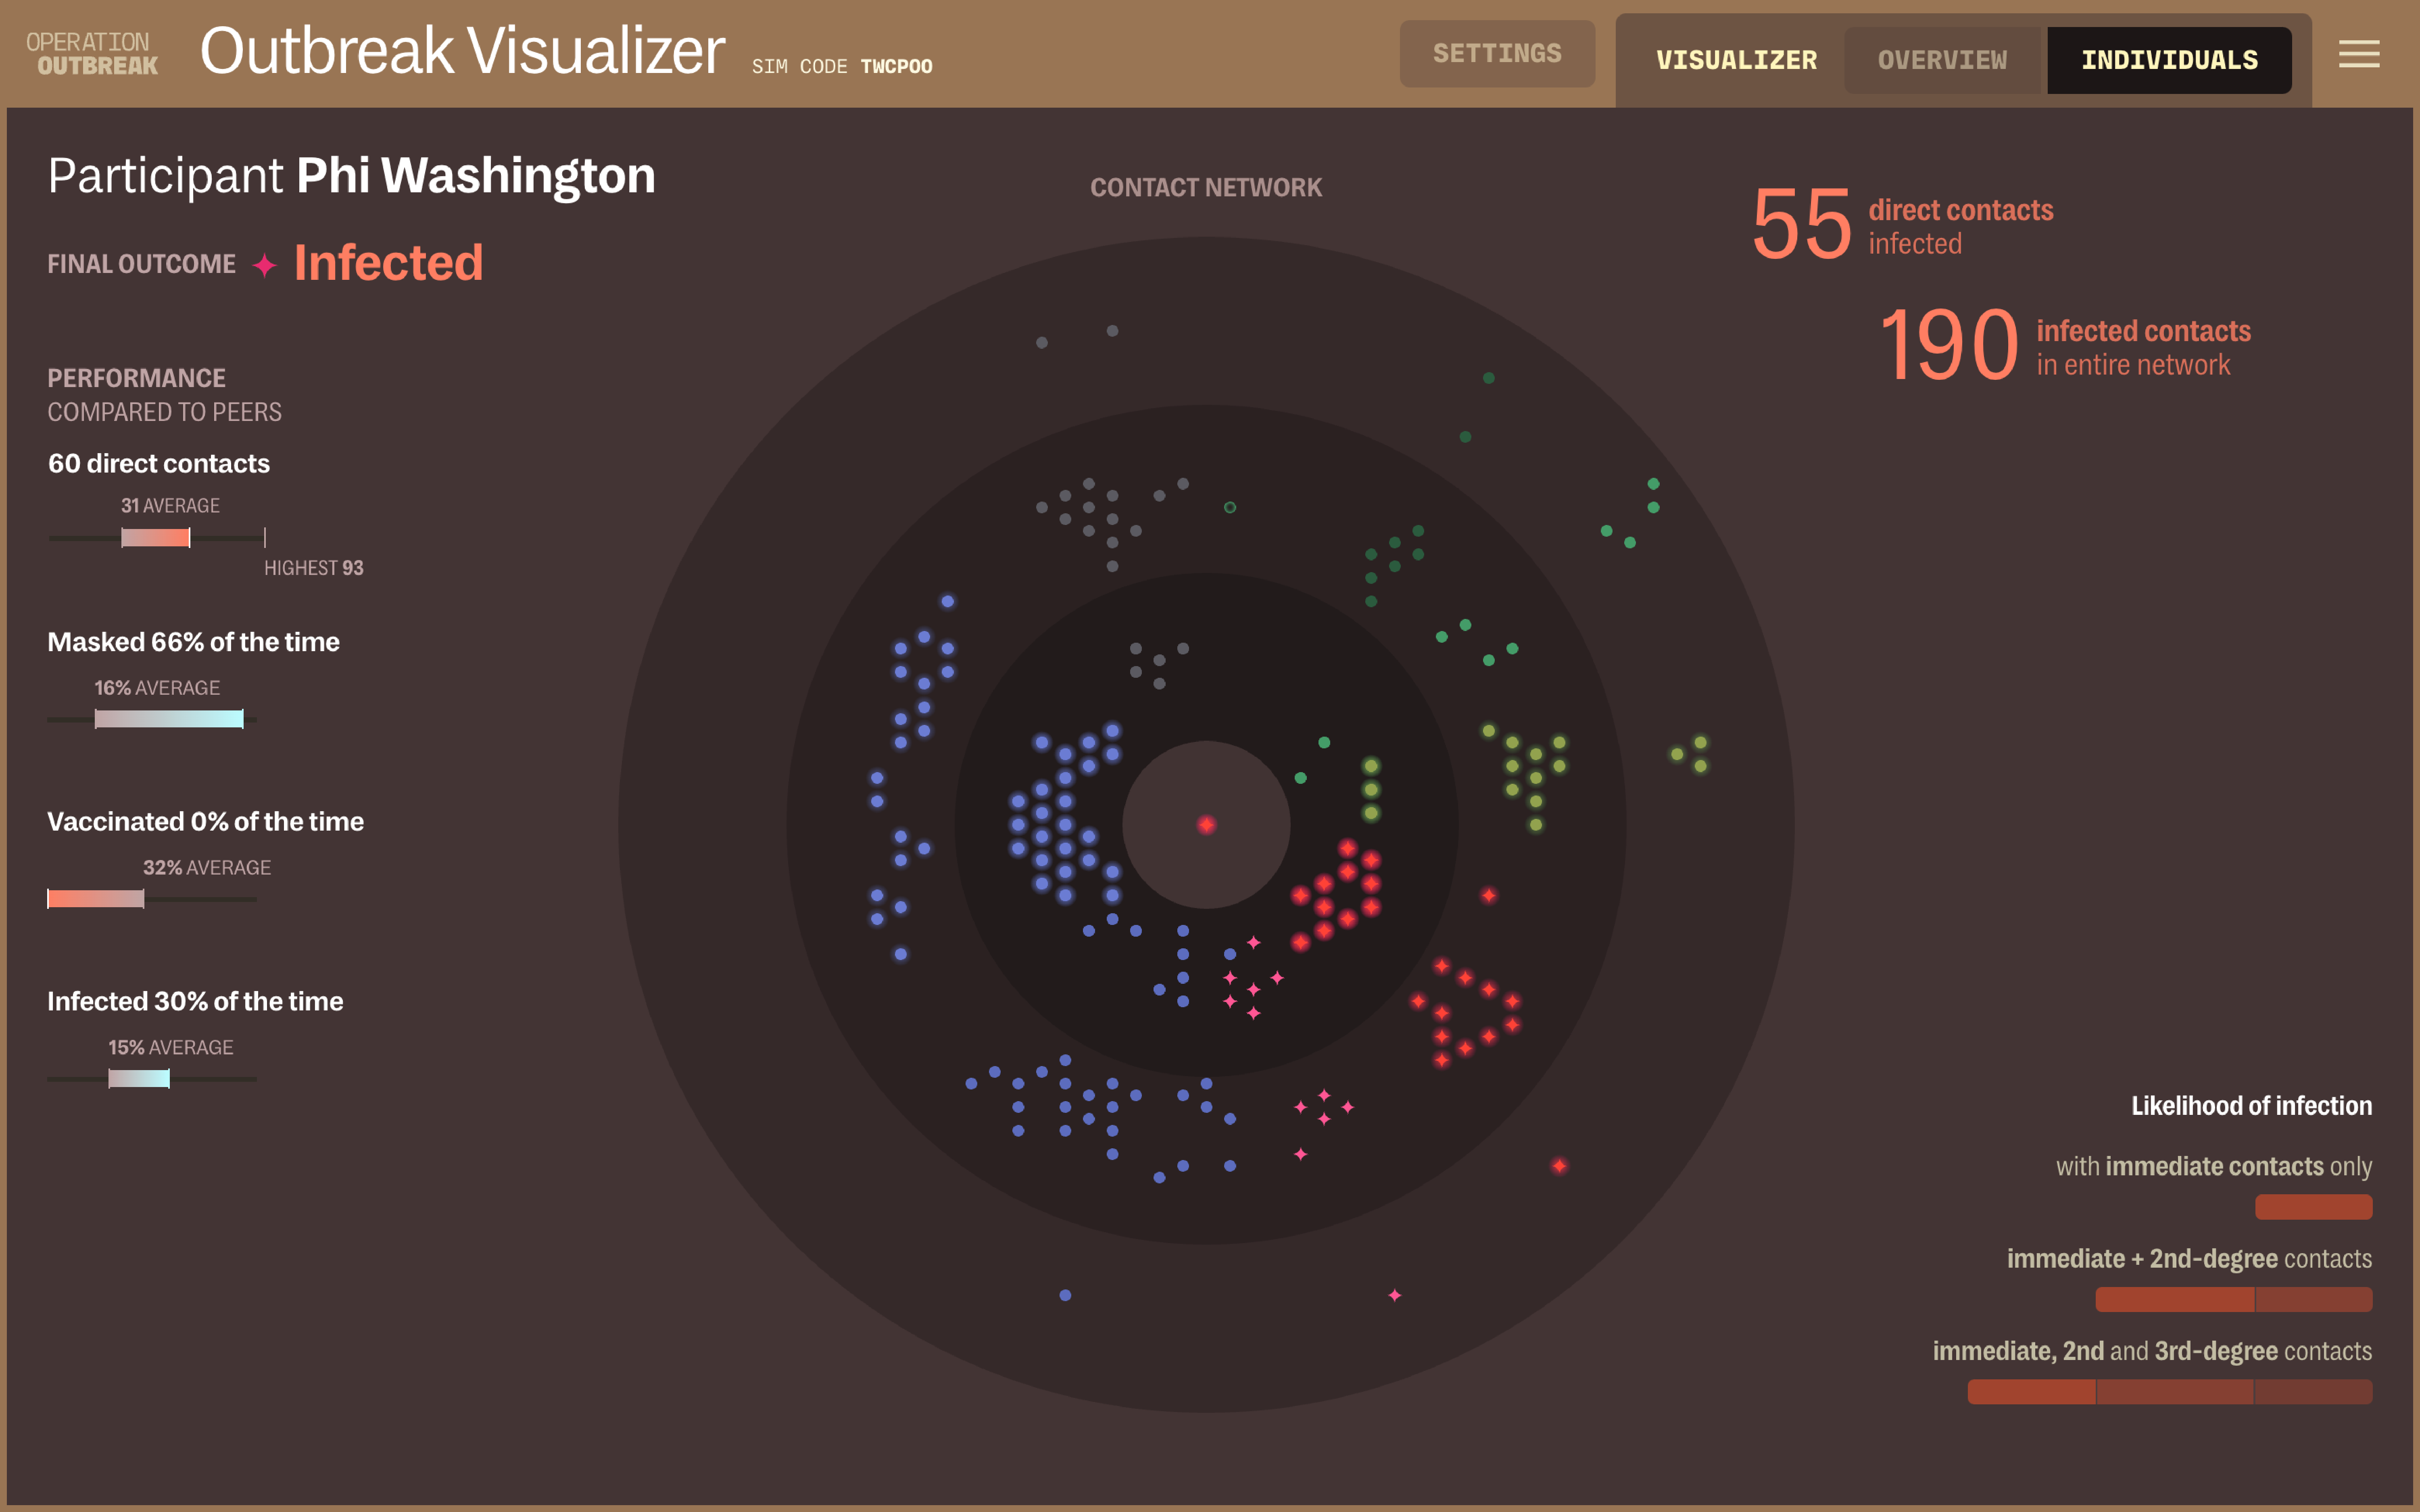
From the Transmission Network view, students can access their own Individual view that maps their contacts as detected by Bluetooth, including second and third degree contacts that would otherwise fall outside of one’s purview. This look into the individual network of each participant helps students comprehend just how far reaching their individual actions can be and the impact any one person can have on their whole community. Here, students can also compare the number of contacts traced during the simulation and actual Bluetooth transmissions that occurred, highlighting when cases have been missed.
With this collaboration, we have been able to help bring Operation Outbreak to a place where they will be able to continue to grow as an organization and a platform. With this new system, they can run more frequent, larger, and complex simulations. It also provides a stable foundation for them to be able to continue building different experimental and production features. With all of this in hand, they can expand their audience, as well as continue to refine the simulation dynamics and learning goals as more simulations are run and observed.