The Sabeti Lab
Operation Outbreak
With support of Sabeti Lab and Operation Outbreak, we built a dashboard visualizing simulated viral outbreak data generated by the OO mobile app. The application allows students to analyze the data from their own simulated viral outbreaks, which enables them to learn about how viruses spread in real situations, and how their individual actions play a part in the spread or containment of viruses.
Capabilities
- Rapid prototyping
- Front-end and back-end implementation
- Design of user experience, visual interface, and data-driven interaction
Operation Outbreak is a mobile game designed for middle and high school students which simulates the spread of a virtual virus using Bluetooth between the students’ phones. Throughout the simulation, students become “infected”, display symptoms, infect others, recover, or die. The game can also simulate access protective gear or vaccines to prevent infection.
The OO team was looking for a way for students and teachers to explore the simulation data in retrospect and visualizations to assist in teaching about outbreak response and epidemiology. With a few weeks working with the data from one of the simulations, we put together a first prototype that focused on watching the playback of the visualization. Viewers could see the full network diagram at any given moment, and click on different participants to follow them through the game and see how their status and interactions changed.
After developing the animation above as a way to first engage the audience, our focus shifted to being able to gain clearer insights into an outbreak, such as seeing how one outbreak was different from another.
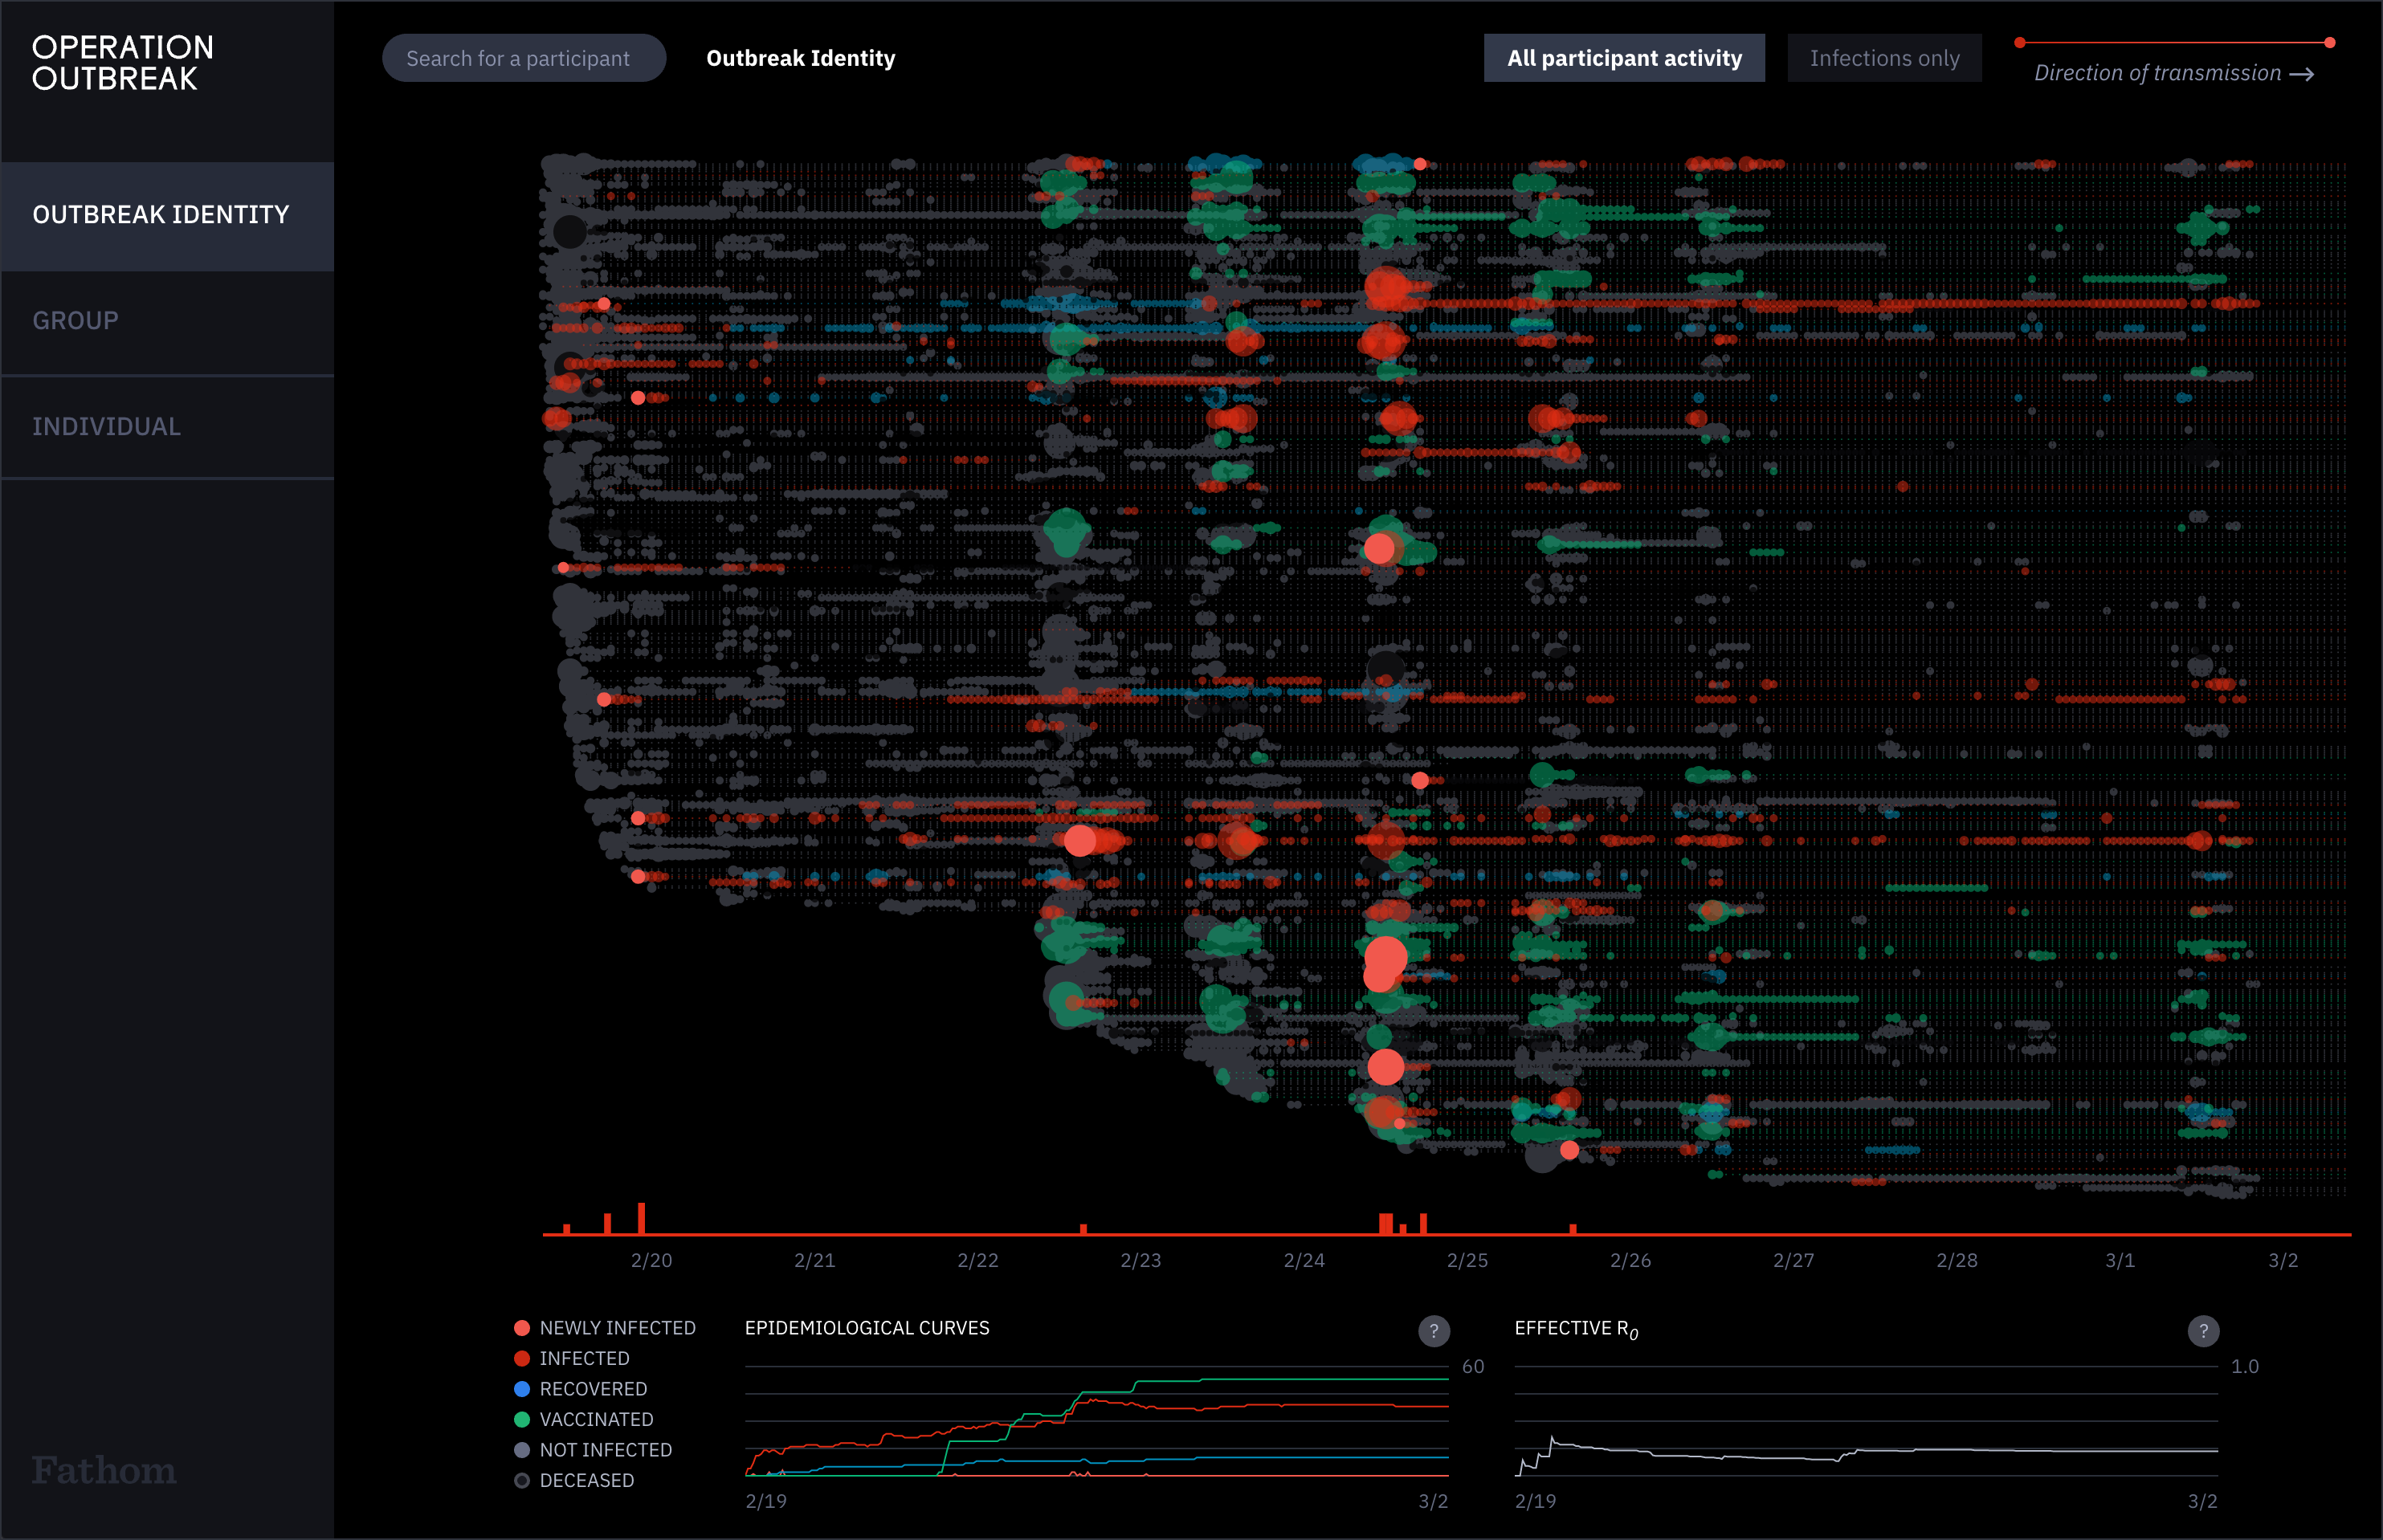
In the latest version, we have created the Outbreak Identity view which depicts a representation similar to an exploded-view drawing of the entire simulation. Through this identity view (which is often called the "thumbprint" around the office), you can quickly see key differences between simulations - How many participants were there? Were there superspreader events, or did people stay distanced? Were people getting vaccinated?
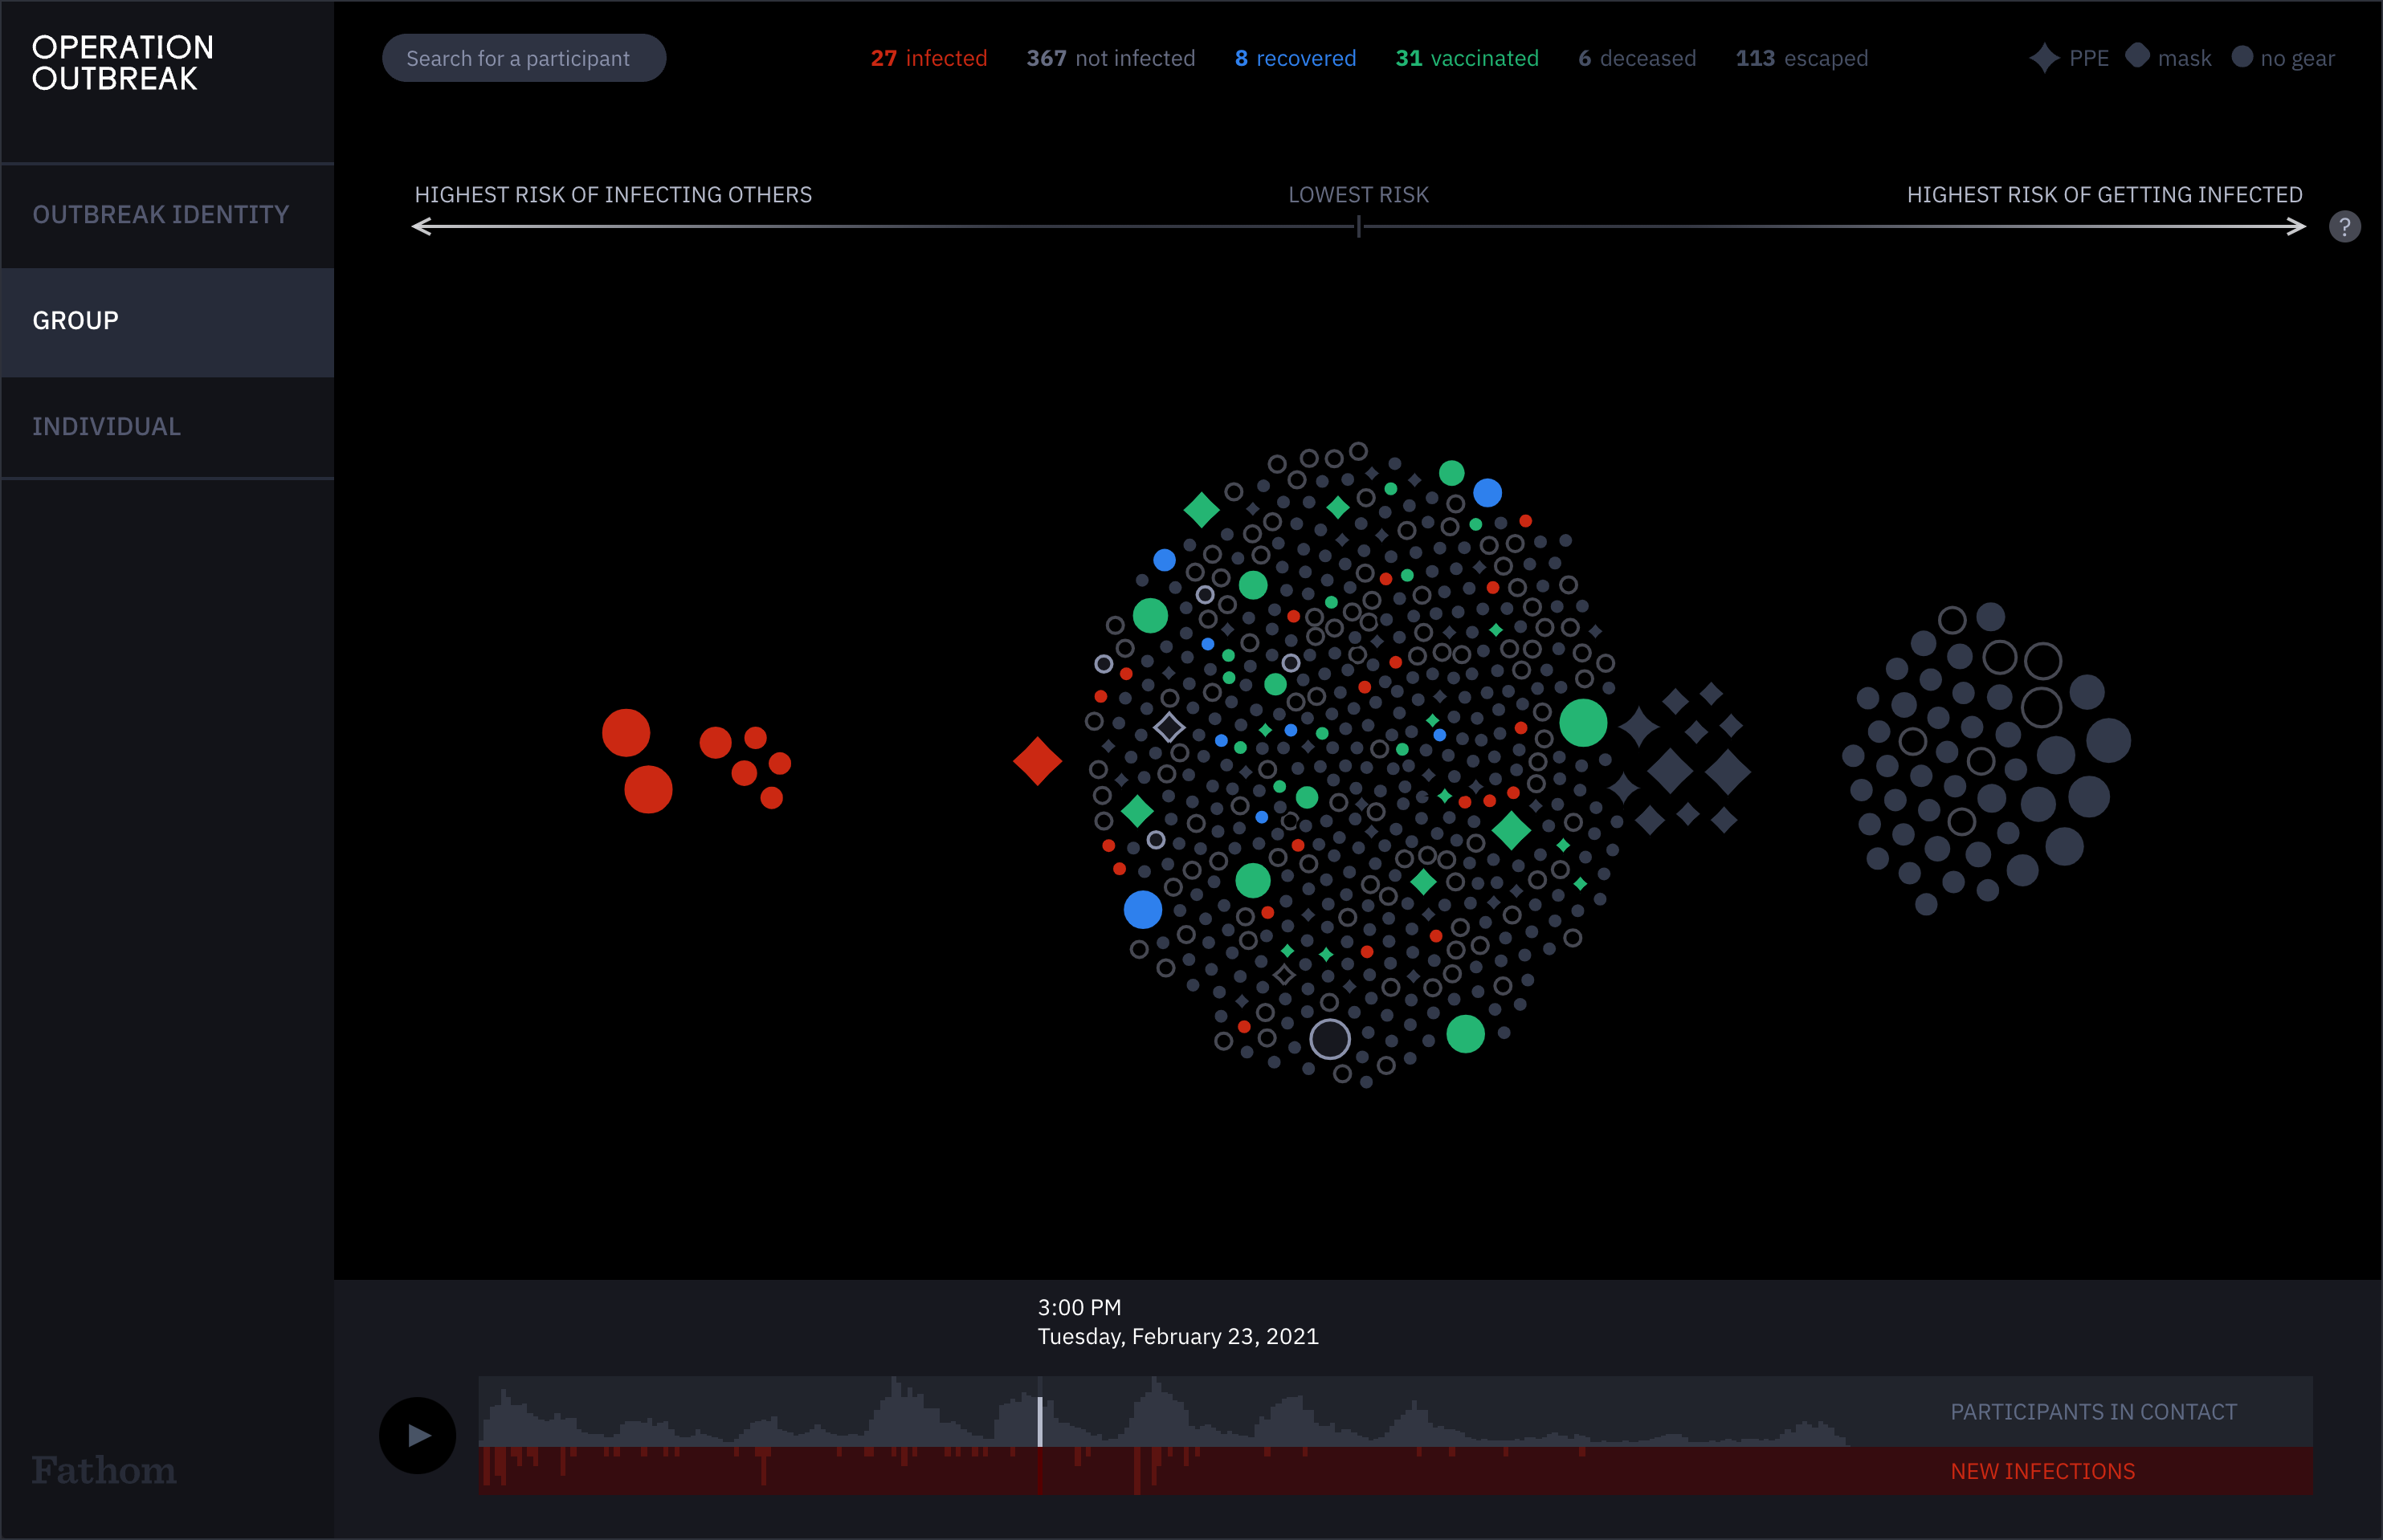
There was also a lot of discussion around a "score" or ranking on how safe or dangerous an individual was throughout the game. We created the Group view as a way to explore those interaction dynamics and place participants along a visual scale of high to low risk for infecting themselves, or infecting others. We felt like this was a good way to help organize and show the variation in how a participants behavior affects others without forcing the data into a complex model or opaque numeric score.
As this first round of the dashboard rolls out with students this fall, we look forward to getting feedback and continuing to work on the next iteration.